
Tooltips in Power BI are a simple feature that is often underutilized. One of the easiest ways to impress your audience with Power BI is a tooltip. This simple idea can provide incredible value to the report readers and elevate your work to next level. In this blog, I will take you through the required steps for creating interactive Tooltip Page but first let’s understand
What are tooltips?
Tooltips are a sophisticated way of providing additional contextual information to data points on a visual that may be missing on the surface when simply looking at the visual. If activated, a tooltip will appear when a user hovers over a data point on a visual with their cursor to reveal the specified details about that specific data point.
Let’s see how to set up and work with tooltips in Power BI.
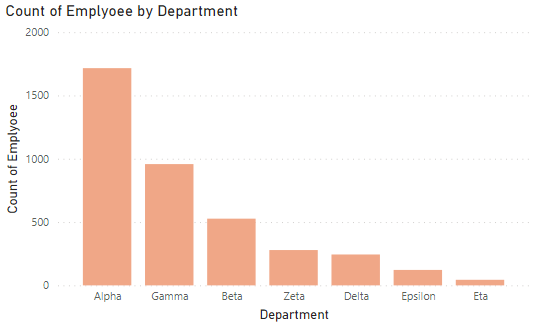
Step 1: Create the main Visual
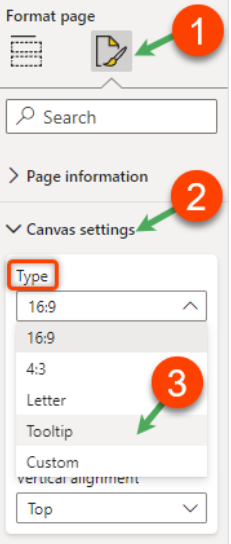
Step 2: Add new page and make it as Tool tip Page
- Click on the “format” options
- Go to Canvas Setting
- Set the page type as “Tooltip” from default

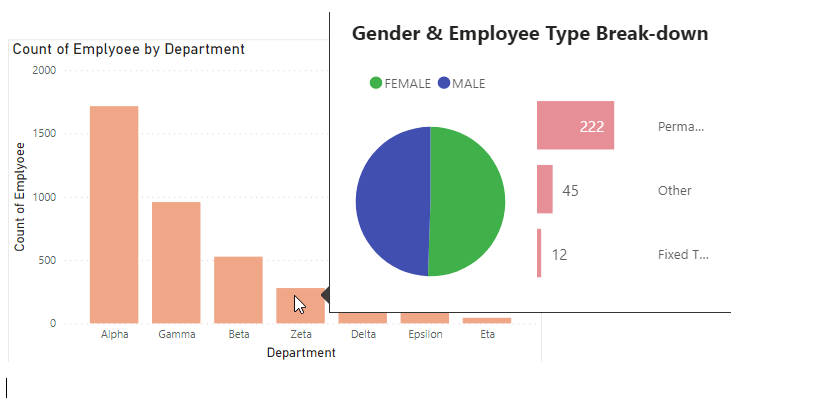
Step 3: Build your Tool tip Page
On This new page, add visual, images, textboxes you want to show in tool tip.
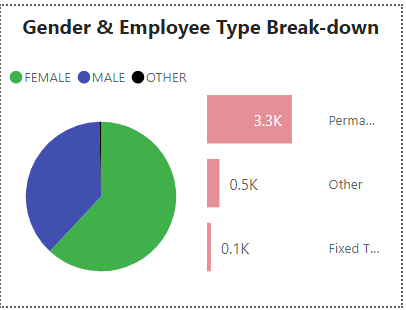
Here I have created pie chart, Clustered Bar Chart, textbox .
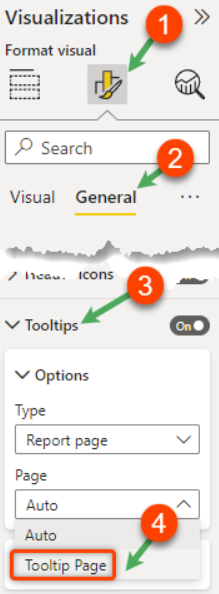
Step 4: Link Tooltip Page to Main Visual.
Go Back to main report page. select your main visual and link it to the tooltip page as per below steps.
- Go to “format” and “general”
- Select the “tooltip” area.
- Set the type to “Report page”
- Select the page from the list of pages.
When you hover over to main visual, tool tip will appear.
Voila! Your tooltip is now set up.