
Azure Application Insights, a feature of Azure Monitor, is a platform as a service (PaaS) offering from Microsoft Azure. It’s a lightweight Application Performance Management (APM) service for web applications used to monitor the live application, automatically detect performance anomalies, and provide analytic tools to diagnose issues and understand the pattern of usage for the web application.
It supports a wide variety of platforms including Sitecore, .NET, Node.js, and Python. With all these in-built features, Application Insights will be able to address timely issues and provide an opportunity to continuously improve.
Azure Application Insights displays data about your application in a Microsoft Azure resource. Creating a new resource is part of setting up Application Insights to monitor a new application. After you have created your new resource, you can get its instrumentation key and use that to configure the Application Insights Software Development Kit (SDK). The instrumentation key links your telemetry to the resource.
Prerequisites to Configure the Application Insight for the Sitecore App Service
- An Azure Subscription Account
- Configured Sitecore App Service
Step 1: Create an Application Insights resource
Sign in to the Azure portal, and create an Application Insights resource:

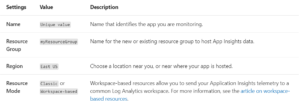
Enter the appropriate values into the required fields below, and then select “review + create.”

When your app is created, a new panel will open. This panel is where you see performance and usage data about your monitored application. You will copy the instrumentation key, which identifies the resource that you want to associate your telemetry data with. You will need to copy the instrumentation key and add it to your application’s code.
Step 2: Install the SDK in Your App
Install the Application Insights SDK in your app. This step depends heavily on the type of your application. Use the instrumentation key to configure the SDK that you install in your application.

The SDK includes standard modules that send telemetry without you having to write any additional code. To track user actions or diagnose issues in more detail, use the Application Programming Interface (API) to send your own telemetry.
What to Know While Configuring Application Insights to Your Sitecore-Based Web Apps
We must be aware that depending upon the different Sitecore packages, a different number of web apps will be created during the configuration of the Sitecore application in Azure, but here is the trick, by default there will be only below four web apps for which the logs need to be looked for:
- Sitecore-cd
- Sitecore-cm
- Sitecore-prc
- Sitecore-rep
We need to remember that Application Insights will only report the logging data for these four web apps when configured. Even if we try to configure the Application Insight for the rest of the additional web apps for Sitecore, we will not see any data reporting for those web apps.
Now that we know the steps to set up the Application Insight in Azure, we will now go ahead and see how the Application Insight setup can be helpful to get the cause for the error occurring in your application. But first, we will learn about the pain points encountered while using the Sitecore logs in the traditional way, which is the standard way to search for logs from the log files rather than using the application insight solution.
Pain Points Using Sitecore Logs
The advantage of using Sitecore over a tailor-made application is the number of built-in features that Sitecore provides, one of them being logging. By default, Sitecore provides Log4Net-based logging. It provides the ability to write data into a log file, but also comes with built-in logic to delete the old log files, which would stop your server’s hard disk from filling.
However, on a large website solution, the standard logs often tend to get mammoth, and whenever we notice an installation issue, finding the exact trace information becomes a cumbersome task. We will revisit this in the latter part of the article.
Application Insights with Sitecore
We’ve seen the most common pain point for using the Sitecore logs, which is figuring out the errors from the logs when needed. This leads us to the next question, “How do we overcome this, and how can we offer updates on the error or warn that it is happening on the website?”
Application Insights comes in handy here. We expect Sitecore to send errors, warnings, and information logs to Application Insights. Along with the Applications Insights, it captures server response times, page load time, failed requests, received requests, and application maps with all connected components.
That’s a lot of information about Application Insights. But how is it going to help the technical support team who is still trying to find the error in the log, figure out the issue, and fix it? We’ll find out through a comparison of Application Insights and logs.
Application Insights Over Logs
To see the advantages of using Application Insights over logs, consider a scenario where one of the pages on the website is displaying 500 errors and the technical support is trying to figure out the error.

If using logs, the technical support team must get the information on the error page and record the date of the error. Then, the team must go to the log directory and find the logs, which are dated as mentioned by the user. If the user is from the same time zone as the server, then we can directly check the logs with the provided time, otherwise, the team must convert it to the time zone of the server and check the relevant logs.
Once the log file of the required data is figured out, then the team must open it using any text editors or specific tools for viewing logs and search for the keyword of the file to figure out the error. In case the search result does not provide any result, then the same must be repeated for a few more log files of different timestamps (not all users who report the issue provide the exact date and time it happened).
Sometimes when we implement a load balancer and have multiple instances of the Sitecore application, the timestamp which the user provides will not be sufficient to figure out the issue at a single stroke. This is because the team must first figure out which instance of the application was consumed by the user and search the required text on the dated log.
Once the search key is identified, the error description or stack traces must be figured out from the logs to identify the root cause of the error. This may seem tedious, but let’s see how we can achieve the same using Application Insights.
In the case of Application Insights, to pull out information from all the instances of Sitecore, a “role” filter can be applied to get the events from all the delivery instances of Sitecore. The next step is to filter out the exceptions. Now we can apply the “date-time” filter with a buffer time added to avoid user errors. All we must do is follow the above steps and Application Insights will provide the list of errors that happened in all the instances during the provided time.

Image: Logs search using Azure Application Insights
Important Azure Resources
Using Azure Application Insights for Sitecore web applications is a great solution. It can also provide analytical insights about the application in no time. For more information on these services, contact our experts today.