On June 25, 2020, I received an email which I suspect most readers of this blog received announcing the release of OneStream XF 6.1.1 which per the email “represents a minor release containing new features, enhancements to existing features, API additions”. Even though OneStream software considers this a minor release, I want to spend a few minutes describing two enhancements which I would consider a reason to prioritize an upgrade.
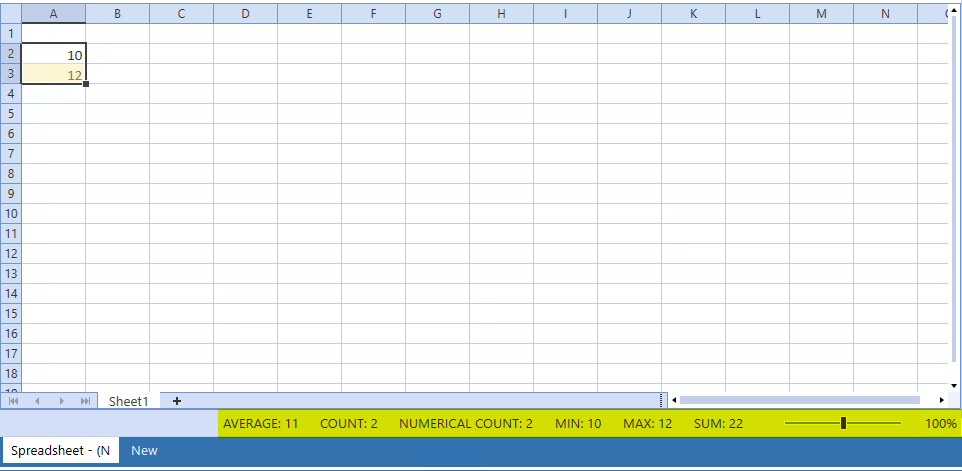
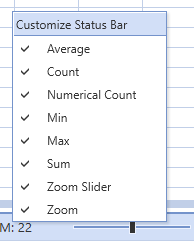
First and foremost, the Spreadsheet page per the Release Notes has the added the capability to “display values on the bottom of the spreadsheet” when highlighting cells. Stated differently, the Excel feature which you may rely on like I do that displays Average, Count and Sum on the status bar is now a feature of the Spreadsheet page. The next image displays the default values listed: Average, Count, Numerical Count, Min, Max and Sum after highlighting cells A2 and A3 as well as the added bonus of Zoom. After a right click on the Status Bar, the values as well as the Zoom option can be unselected. This is displayed in the second image.
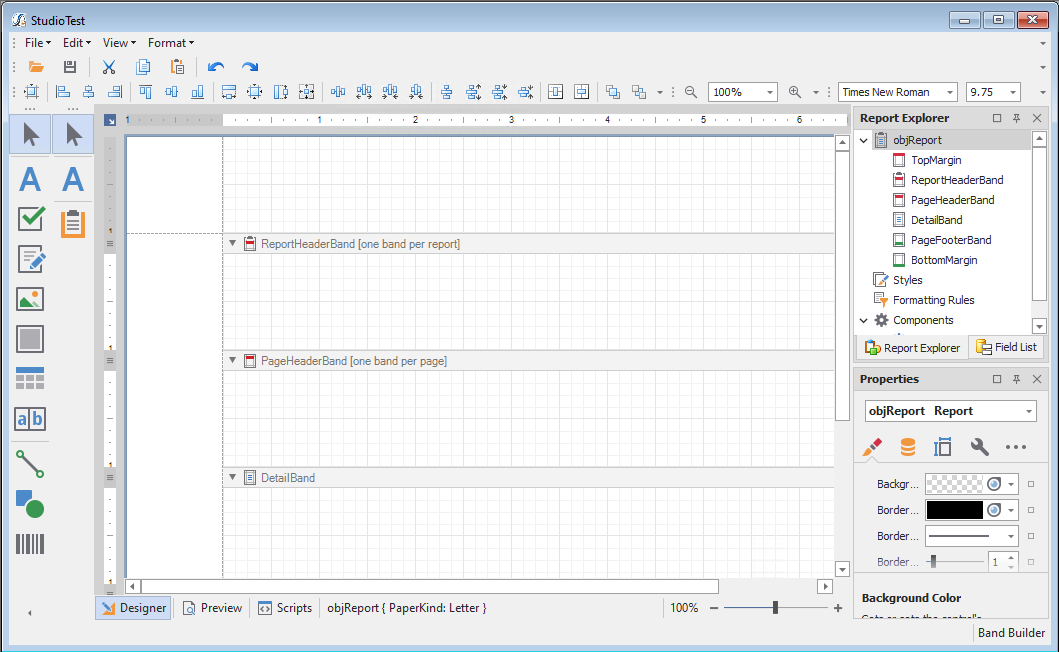
Another productivity enhancement to the OneStream Windows Application in this release is the addition of Report Designer which is effectively the addition of OneStream Studio to the Windows Application. While I may not use Report Designer on a daily basis, I do use it frequently on most projects. With the OneStream Windows Application accessible without an install from Internet Explorer, then a desktop shortcut away this is one less software product to install during an upgrade.
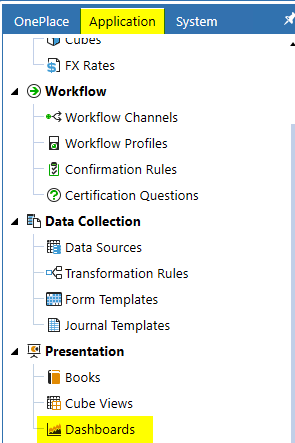
To access Report Designer, execute the Windows Application and then log into an application. This example will proceed with the GolfStream application. After a successful authentication, select Application -> Dashboard.
Create and save a Data Adapter an example of which is displayed in the next image. For simplicity, the Data Adapter is a SQL Query which will return a result set from Application view, vStageSourceAndTargetDataWithAttributes, which contains source and target values as well as attributes if applicable from one or more import processes. From a process perspective, the record set returns the Import and Validate / Load screens from an Workflow Import process.

Next create a Dashboard Component by selecting the highlighted icon ![]() .
.
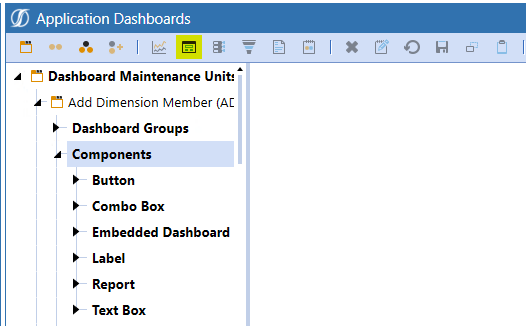
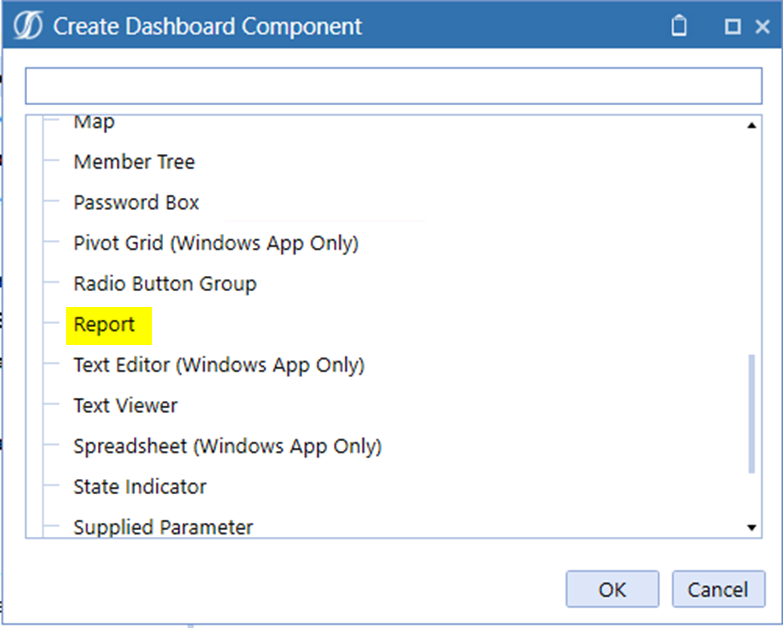
From the Create Dashboard Component dialog box, select Report and then OK.
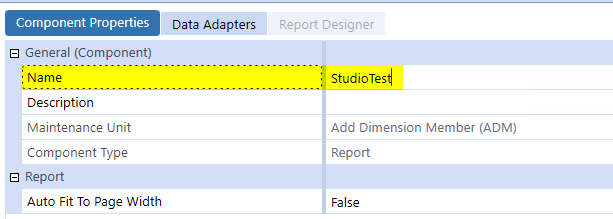
Key a Name “StudioTest” for the Component Property and then select Data Adapters.
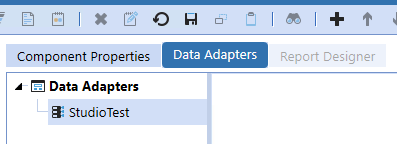
Add the previously created Data Adapter, StudioTest, and then select Save.
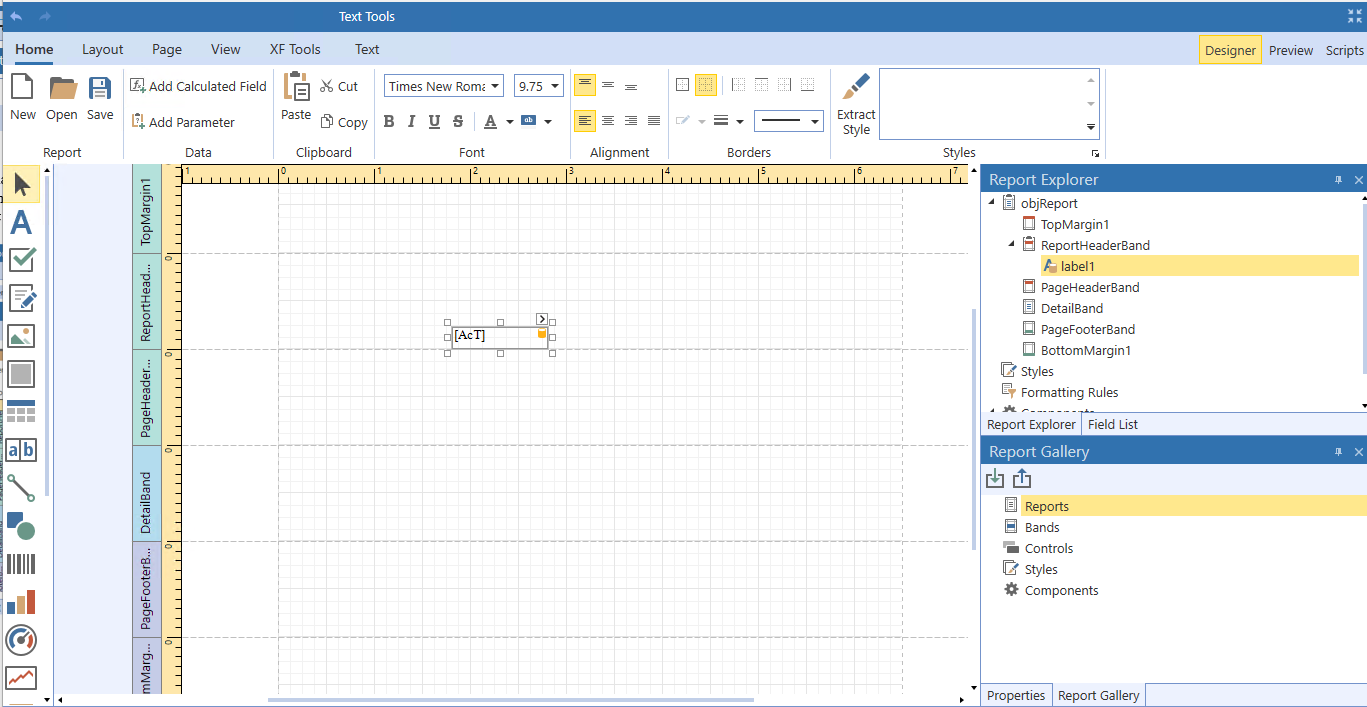
Select Report Designer displayed in the next image and begin creation of the report layout etc. using the comparable functionality of this enhancement instead of OneStream Studio. For comparison, the same Report is displayed in OneStream Studio in the second image.
I hope this blog has been helpful. If you have any questions, feel free to either post a comment to the blog or email me at terry.ledet@perficient.com.

