
Typically, the idea of container orchestration is associated with DevOps, and while IT departments have quickly adopted the tech for OPS, the development part has been misunderstood and underrated. With the array of OpenShift tools at a developers’ disposal, it’s time to deliver on the premise of DevOps and bring power back to the developers.
Coders like to code, but most would rather spend more time building cool stuff than wasting it on boilerplate. That’s why we use frameworks. For example, when we start a project, we want to jump right into it instead of learning how to set up an Elasticsearch cluster.
Large organizations require you to create IT tickets and wait for provisioning, which can be a major roadblock. Sometimes it’s because IT is very busy. Sometimes it’s because they don’t know how to provision these things, and sometimes it’s because they are concerned about security. OpenShift has a powerful way to address all of that.
The other important aspect of container adoption is that programmers might be under the impression that they have to learn all about Docker or use a different language than the one they’re familiar with.
For this exercise, we’re not going to build a simple hello world, run a microservice on an OpenShift-type scenario because it wouldn’t illustrate these points. We’re going to build a sophisticated application with a lot of moving parts that delivers true value. We’ll demonstrate how easy it is to do with OpenShift, and on Day 1.
Use Case
For this demo, we’re using a fish farm with growing tanks. The water temperature in the tanks needs to remain within a safe range, especially in the winter. If the temperature drops below a certain point, it will cause damage to the fish.
The tanks are equipped with internet-connected thermostats that control the heaters. We’ll use the thermostat readings to ensure maximum efficiency and identify early signs of failure.
Efficiency is calculated by the rate of temperature increase when a heater turns on. For demo purposes, we’ll assume that a one-degree increase per second is our standard. (In the real world, that would not be true, as the tanks would boil in a matter of seconds, but this is so we can see the changes quickly in the demo.)

Figure 1 – Infrastructure
Data Flow
- The gateway will feed the temperature readings to our application through a REST service
- The service will dump the readings into a message queue
- The processor service will consume the messages and calculate the current efficiency for each device
- It will then publish the efficiency records to a second queue, as well as expose them as a metric that will be monitored in real-time
- We’ll also monitor the raw temperature readings and present them in a dashboard
- Finally, alerts will be generated when appropriate and published to another message queue to be dispatched appropriately
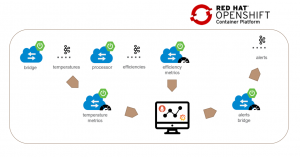
Figure 2 – Architecture
And of course, everything will be running on OpenShift.
Environment
We need an OpenShift cluster on version 4 or newer. This is because we’re going to use Operators to facilitate the provisioning of our middleware. A vanilla installation is good enough, as you can run it on a single node, and now you can even use CodeReady Containers, which allow you to run OpenShift on your development machine.
You can also use evaluation licenses and deploy a test cluster on AWS, which will give you access to storage, on-demand scaling, etc., all out-of-the-box.
Kafka
Kafka is stream processing software. For those coming from classic, event-driven systems, you can think of it as a message queue, but it does a lot more than that. What’s of interest to us is the real-time streaming analytics, sliding-window calculations.
To calculate our efficiency, we need to compare two consecutive temperature readings, and without Kafka, you would need to maintain a state in some sort of cache, which will force us to do more coding, and that’s precisely what we’re trying to avoid. Kafka is also future-proof. Check out this article for an introduction to Kafka Streams.
The enterprise version of Kafka is provided by Red Hat under the name AMQ Streams, a downstream project of the open-source initiative Strimzi. It comes with seamless integration with the OpenShift ecosystem.
Prometheus

Figure 3 – Grafana Dashboard Example
Prometheus will be used as our metric monitoring system. It connects to your services at a given interval, scrapes the data that you want to watch, and stores it in a time-series database. You can then give it rules and it will generate alerts and publish them to an endpoint of your choosing or send an email or other notifications. We’ll also install Grafana, which is the standard visualization tool for Prometheus, and you can import community dashboards for commonly used tools like Spring Boot and Kafka. OpenShift uses Prometheus internally to monitor the cluster.
Spring Boot and Spring Cloud Streams
For our microservices, we’re going to start with a plain Spring Boot application and add a few modules that will make things easier:
- Actuator: Provide health check endpoint for OpenShift to watch, and pair it with the Prometheus module to expose all of our internal service metrics like response time, JVM details, etc., as well as some custom metrics to monitor our temperature and efficiency.
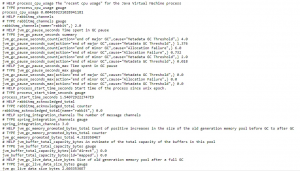
Figure 4 – Spring Boot Actuator Prometheus Output
- Spring Cloud Stream: Provides an abstraction for Kafka Streams. It’s similar to Spring Data for relational databases in that it manages the connection to Kafka, serializes and de-serializes messages, etc. It also integrates with the actuator module so we can watch our integration metrics in Grafana and set up rules in Prometheus. Check out this video for an introduction to Spring Cloud Streams with Kafka.
Operators
At this point, we need to install our three middlewares on OpenShift. In version 4 and newer, the entire platform is constructed around the concept of Operators. At a basic level, Operators are regular applications that manage other applications’ lifecycles. They ensure that all the components of an application are set up properly and watch configuration changes to take appropriate actions in OpenShift. For our immediate purpose, you can just think of them as installers for complex application stacks.
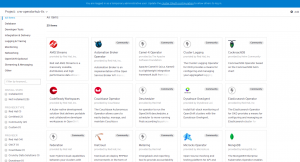
Figure 5 – OpenShift Operators Catalog
OpenShift’s Operator Catalog is accessible directly from the UI, and you can choose from the list of curated software, install, and create instances of those applications. It requires zero knowledge of the underlying infrastructure and they come with production defaults so you don’t have to customize anything at first.
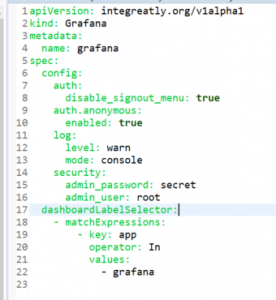
Figure 6 – Grafana Custom Resource
The way you do that is by creating a Custom Resource, which is the abstract representation of an application’s infrastructure, in a YAML format.
Code Overview
Thermostat Service
I wanted a low-code solution, and if possible, I didn’t want to learn too much about Kafka. All I want to do is produce messages and dump them into a topic, then consume them on the other end and produce another message as a result.
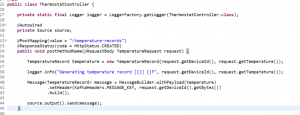
Figure 7 – Intake Service
This standard Spring Boot Rest Service takes in a message from the IOT Gateway, wraps it into a standard Spring Integration message, and sends it to the output, which is bound to our temperatures topic. We then add the config to tell Spring where our Kafka cluster is, and what topic to send the message to and let it do all the heavy lifting. We didn’t write any Kafka-specific code – Spring will make that topic available to us through a Source bean that we can auto-wire.
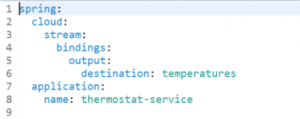
Figure 8 – Spring Cloud Stream Config
Processor Service

Figure 9 – Processor Function

Here we leverage the Kafka abstraction for streams, and we create a simple Function that takes in messages from the temperatures topic as an input, augments the record with the calculated efficiency, and sends it to our efficiency topic.
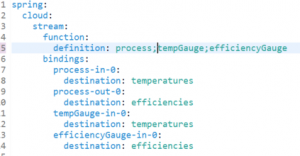
Figure 10 – Spring Cloud Stream Processor Config
Here we declare that we have a processor function, and configure Spring to bind its input and output to specific Kafka topics. By convention, functionName-in-x for inputs and functionName-out-x for outputs. In this case, we used a few Kafka-specific APIs with KStream because we want to leverage Kafka’s ability to do time-based calculations.
We also want to track the temperature and efficiency data and expose them as metrics to Prometheus, so we add our two consumers accordingly:
- tempGauge: Consumes raw temperature messages from the temperatures topic
- efficiencyGauge: Consumes augmented message from the efficiencies topic
Then all we need to do is auto-wire the MeterRegistry that’s made available to us by Spring Actuator, and update the metric values with the reading from the topics for each device.
Keep in mind, that at this point, we haven’t added any Docker or OpenShift-related code at all.
The Demo
For convenience, we created a Helm Chart that will install all the application components for you automatically, assuming you installed the Operators as described in the previous steps.
Instructions to install the demo are available in the git repository README file.
If you are only interested in running the demo, you can skip the following two sections and click here to watch the demo, which begins at 21:50 of our Modernize Applications with Red Hat OpenShift on AWS webinar.
After the installation is complete, you can access the Prometheus, Grafana, and Alertmanager UIs by clicking the links in the Networking > Routes page of the OpenShift console.
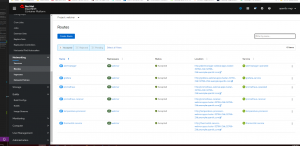
Figure 11 – Openshift Routes Page
Prometheus should show all three services up and running on the Targets page.

Figure 12 – Prometheus Targets Post-Install
Manual Deployments with Source-2-Image (S2I)
We used Helm to install everything to save time, but we could have deployed the application manually instead. Applications on Kubernetes run inside Pods, which manage one or more containers, and containers run Docker images. OpenShift provides an easy way to package and run applications without any code change if you use one of the standard runtimes.
Open the developer perspective in the OpenShift web console, click add, point to where your code is on Git, pick a runtime, and that’s it. OpenShift will set up a number of things for you automatically:
- OpenShift will leverage a feature called S2I or Source-to-image to create a Docker image directly out of your source code. S2I clones your code from a git repo – public or private, figures out how to compile and package your app, and wraps it inside a Docker image that already knows how to run your code. For example, if it’s a Java project, it will detect a maven or groovy configuration and package your app in a Jar file. In the case of Spring Boot, use a Java11 Docker image to start the webserver. If you’re using NodeJS, it will run npm install and npm start, and even React apps runtime is now available.
You can code your application the way you already know how – just make sure you use industry standards and conventions, which you probably already are.
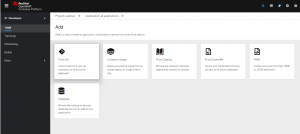
Figure 13 – Deploy Service
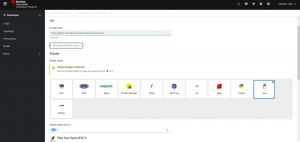
Figure 14 – Deploy From Git
- OpenShift creates a DeploymentConfig, which describes how we want our application deployed. In this case, just one instance, with one container, standard CPU, and memory allocation. It will also configure it so the application will be automatically re-deployed when we push a new build.
- It then creates a Service, which exposes our application to the rest of the cluster so other services can talk to it using the OpenShift internal DNS.
- Finally, it creates a Route, which exposes the application outside of the cluster and gives it a public URL. In this case, it also mapped a standard HTTP port to the default 8080 port Spring uses for the webserver. When it’s all said and done, we have a public URL that we can open in a browser. You can find the link generated for your service by going to the OpenShift web console Networking > Routes page.
To install this demo manually, add the three services present in the git repository that way. You have to make sure you go into the advanced git options and enter the name of the sub-directory containing the service in the Context Dir field.
Manual deployment of Kafka and Grafana is very straightforward using the Operator > Installed Operator feature in the OpenShift console, but Prometheus is a bit more involved. I’ll dedicate a blog post to that subject later on.
Running the simulation
Complete instructions to install and run the simulator are available in the git repository README file.
The simulator uses a Spring Boot REST client to send temperature records to the thermostat service using the /temperature-records endpoint. By default, it generates a one-degree increase message every second for pond_1, which represents a 100% efficiency for demo purposes.
- Clone the git repository on your local machine
- Go into the thermostat-simulator directory
- Run the simulator with Maven: mvn spring-boot:run -Dspring-boot.run.jvmArguments=”-Dsimulator.url=[thermostat service url in openshift]/temperature-records”
You should see the temperature records that are printed to the console. You can verify that the records are being consumed by going to the pod logs in the OpenShift console, for both the thermostat service and temperature processor service.
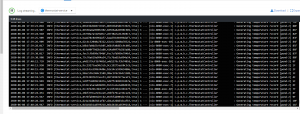
Figure 15 – REST Service Logs
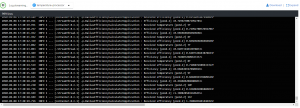
Figure 16 – Processor Service Logs
You can also look at the Temperatures dashboard in the Grafana UI, which should show ~100% efficiency for pond-1.
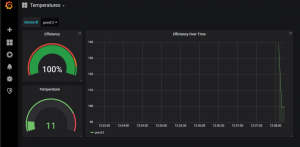
Figure 17 – Grafana Dashboard 100%
Now we can run a second simulator at 100%. In a separate terminal:
- Run the simulator with Maven: mvn spring-boot:run -Dspring-boot.run.jvmArguments=”-Dsimulator.id=pond-2 -Dsimulator.url=[thermostat service url in openshift]/temperature-records”
- Go to Grafana and select pond-2 in the Temperatures dashboard at the top
- Notice the efficiency is at ~100%
At this point, it’s worth noting that we didn’t set up anything in Kafka. Spring Cloud Stream automatically created and configured the topics for us. If you need to tune those settings, you can use the Operator custom resources to create the topics beforehand and specify sharing and permissions in the YAML file.
Now let’s simulate a failure on pond-2. To do that, we simply change the temperature increase rate to one degree every 1.5 seconds by setting the simulator.rate property to 1500 in our simulator.
- Stop the simulator on the second terminal
- Run the simulator with Maven: mvn spring-boot:run -Dspring-boot.run.jvmArguments=”-Dsimulator.id=pond-2 -Dsimulator.rate=1500 -Dsimulator.url=[thermostat service url in openshift]/temperature-records”
The water is now heating slower than before, which reduces the efficiency to ~66% (1/1.5). This will be reflected almost instantly on the dashboard.
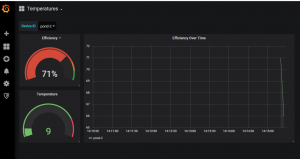
Figure 18 – Grafana Dashboard 66%
You should see a new alert on the Prometheus Alerts page (keep refreshing the page as Prometheus doesn’t show real-time alerts). The initial status of the alert will say PENDING (yellow) then change to FIRING (red) after a minute. This is because we set up the alert to only fire after a minute of the condition to avoid false alarms. When the alert is firing, notifications will be sent to the chosen destination at the configured interval.

Figure 19 – Prometheus Alert Pending

Figure 20 – Prometheus Alert Firing
Finally, let’s restore the efficiency by stopping the simulator and restarting it with the normal rate:
- Stop the simulator on the second terminal
- Run the simulator with Maven: mvn spring-boot:run -Dspring-boot.run.jvmArguments=”-Dsimulator.id=pond-2 -Dsimulator.url=[thermostat service url in openshift]/temperature-records”
The alert status should go back to green on Prometheus after a few seconds.
Production Considerations
What do you need to do if you want to deploy your solution in a production environment?
- Ensure the production environment is the same as the test environment to avoid the classic “it works in my environment” problem. Because everything in OpenShift is a YAML config file, you can copy the files into your project to effectively source control your application infrastructure. Move these files to your prod cluster and deploy your app. You can have one branch per environment with different configurations and you don’t have to explain to IT how to run your stuff.

Figure 21 – DeploymentConfig Thermostat Service
- You want to make sure all these components will scale. For things that are managed by Operators like Kafka, the default configurations are usually a solid starting point, but you can tinker with it and find what’s right for you.
- For your own services, OpenShift will keep an eye on your pods and replace the ones that die for one reason or another. It’s a good idea to have at least two replicas in prod so you’ll always have one running while OpenShift bootstraps a new one.
- Spring Boot also comes with production-grade defaults, and because we didn’t write much code at all, and the services are stateless, you can scale them up and down very easily and safely. If you went with the extra step of creating your own Operator, you can configure it so your services and your Kafka cluster scale in sync. Or, re-balance data, execute backups, etc. (See the replicas: 1 field in the previous screenshot. Change it to 2 or more.)
- On most clusters, OpenShift monitoring and logging is installed out-of-the-box, but if they are not, there is an Operator for that. Cluster Monitoring gives you access to the internal Prometheus/Grafana cluster and allows your NOC to monitor your app on Day 2.
- Cluster Logging will set up an Elasticsearch cluster and a Kibana GUI and automatically stream your application logs to an index where they can be organized and searched and parsed, etc. That’s useful when you want to troubleshoot particular conditions or do post-mortems if a pod dies.
- If you want to do Blue/Green deployments, versioning, authentication, A/B testing, etc., there is a product called Service Mesh in OpenShift that allows you to configure these easily without touching your code. There is an Operator for that of course – it’s a bitmore advanced but not out of reach for the everyday developer either.
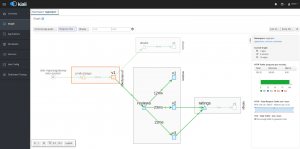
Figure 22 – Service Mesh
- Remember that when you build your applications around Kafka, you can easily add new features down the road? One of AMQ Streams’ companions is Fuse Online, a Red Hat product that lets you create integrations around Kafka without having to write a single line of code.
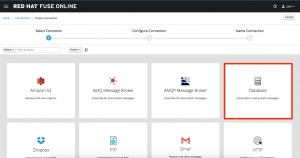
Figure 23 – Fuse Online
For example, we can use it to consume our alerts topic and send AWS SNS notifications. Or we can install an Elasticsearch cluster using the Operator and log our metrics there to create executive reports and even do machine learning.
Conclusion
We created a fairly complex application with very little code or knowledge of the underlying technologies. We used a familiar Java framework, and thanks to its tight integration with OpenShift and the use of other OpenShift native techs, we were able to wire things up together.
As a developer, I can now be given my project space in the OpenShift cluster and create my ideal development environment. I can set up clusters and tear them down in an instant – I’m not required to change the way I code or learn about Docker or Kubernetes, and I only coded the part that’s actually providing business value. Plus, I’m able to describe my application infrastructure in yml files so I don’t have to explain it to IT or deal with conflicting configurations from different groups. I’m in control.
And thanks to the numerous OpenShift tools available to deal with production concerns, I don’t have to bake all these things in my code, so it’s a lot easier to maintain, leaner, and more to the point.