Introduction
Organizations are usually posed with the challenge of turning data into valuable insights. They realize the need for utilizing increasing amounts of “Big Data” in order to compete with other organizations in terms of efficiency, speed and service. The incredible growth of event data poses new challenges. As event logs grow, data processing techniques need to become more efficient and highly scalable.
An OLAP cube is a data structure that overcomes the limitations of relational databases by providing rapid analysis of data. It is a Multidimensional cube that is built using OLAP databases. OLAP cubes can display and sum large amounts of data while also providing users with searchable access to any data points so that the data can be rolled up, sliced, and diced as needed to handle the widest variety of questions that are relevant to a user’s area of interest.
An OLAP cube connects to a data source to read and process raw data to perform aggregations and calculations for its associated measures. The data source for all Service Manager OLAP cubes is the data marts, which includes the data marts for both the Operations Manager and Configuration Manager.
There are three components associated with any Data cube: Measures, Dimensions and Hierarchies.
The OLAP operations with the SQL queries in real time are explained below:
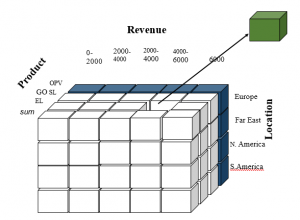
Fig 1 – Data cube :Graph representation
Roll up (drill-up):
ROLLUP is used in tasks involving subtotals. It creates subtotals at any level of aggregation needed, from the most detailed up to a grand total i.e. climbing up a concept hierarchy for the dimension such as time or geography. Example : A Query could involve a ROLLUP of year>month>day or country>state>city. When a roll-up is performed, one or more dimensions from the data cube are removed because the output would display blank for certain rows.
The Below ROLL UP operation example would return the total revenue across all products at increasing aggregation levels of location: from state to country to region for different Quarters.
Query Syntax:
SELECT …GROUP BY ROLLUP ( grouping_Column_reference_list);
Example:
SELECT Time, Location, product ,sum(revenue) AS Profit FROM sales GROUP BY ROLLUP(Time, Location, product);
The Query calculates the standard aggregate values specified in the GROUP BY clause. Then, it creates progressively higher-level subtotals, moving from right to left through the list of grouping columns. Finally, it creates a grand total.
Benefits of using ROLLUP:
The above subtotal operation could be achieved using 4 ‘SELECT’ statements with UNION ALL. The Query performance is inefficient, as it involves table access multiple times and the syntax is also complicated.
Drill down (Roll down): Query Syntax:
This is a reverse of the ROLL UP operation discussed above. The data is aggregated from a higher level summary to a lower level summary/detailed data.
Query Syntax:
SELECT … GROUP BY ROLLDOWN(columns);
Example:
SELECT Time, Location, product ,sum(revenue) AS Profit FROM sales GROUP BY ROLLDOWN(Time, Location, product);
Slicing :
A slice in a multidimensional array is a column of data corresponding to a single value for one or more members of the dimension. It helps the user to visualize and gather the information specific to a dimension. When you think of slicing, think of it as a specialized filter for a particular value in a dimension. For instance, if a user wanted to know the total number of OPV products sold across all of the market locations (Europe, Far-Ease, North America, South America,) the user would perform a horizontal slice (shown in blue in Fig 1.)
Query Syntax:
Selection conditions on some attributes using <WHERE clause> <Group by> and aggregation on some attribute
Example:
Select products, sum(revenue) from sales where Products= ‘OPV’ GROUP BY Products ;

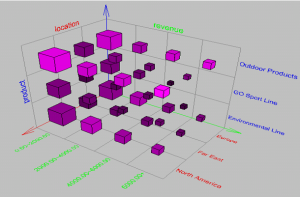
Fig 2 – Data cube :Slicing and Dicing
Dicing:
Dicing is similar to slicing, but it works a little bit differently. When one thinks of slicing, filtering is done to focus on a particular attribute. Dicing, on the other hand, is more of a zoom feature that selects a subset over all the dimensions, but for specific values of the dimension. For instance, if a user wanted to know the revenue earned due to the EL product in the particular market location of Europe, the user would perform a dicing operation (shown in green in Fig 2.)
Query Syntax:
Selection conditions on some attributes using <WHERE clause> Group by and aggregation on some attribute
Example:
Select products, sum(revenue) from sales where Products= ‘EL’ and Location=’Europe’ group by Products;


