Website performance is incredibly important for most companies. This is especially true in situations where a website might be accessed by a huge number of customers within a short period of time (think Black Friday or a utility company with a widespread outage). While performance can mean different things to different people (time to first byte, perceived performance, etc.), we can all agree performance metrics are an important part of every modern web project.
Perficient was recently brought on by a customer to help fix their Sitecore based website’s performance problems. Performance under normal use was good but the solution could not hold up under heavy load (with page load times taking up to 30 seconds). In this case, the requirement was to serve 1.3 million page views over the course of 2 hours – something that Sitecore is more than capable of doing given the correct infrastructure and proper performance minded setup, configuration and code.
Initial Steps
Sitecore has some really great built-in performance tools. Specifically, there are a few tools that come in quite handy when accessing performance of an installation:
- Sitecore admin cache page – The /sitecore/admin/cache.aspx page displays the details of all of Sitecore’s caches. In this case, most of the caches looked reasonable (with many of the configuration settings either at the default or increased in size), at this step we discovered that the output (HTML) cache was turned off at the site node level (more on this later).
- Sitecore Debugger – The Sitecore Debugger provides a great deal of valuable data including trace information that details rendering execution timing. Under no load, the debugger provided no useful insights as to the problem. Under heavy load (which we simulated using Apache JMeter), no particular rendering stood out as the application had already crumbled under the simulated load.
- Sitecore Logs – Lastly, we closely examined the Sitecore logs for errors. In our particular case, we didn’t see anything of note in the logs but fixing errors that show up in your logs could be a good first step to improve performance.
Enter Dynatrace
At this point, we started to think about diagnosing the problem from a .NET perspective. Remember that Sitecore is an ASP.NET application and can be profiled in the same way you might profile a custom application or service. There are number of popular profiling tools available but we decided to use Dynatrace.
Dynatrace, a Sitecore Silver Technology Partner, is ranked number #1 for market share of application performance, with over 7,500 global clients. Dynatrace provides code level insight into the performance of .NET applications, from browser to database, and every tier between. Think of Dynatrace as an application X-ray and MRI machine that can see every line of code that executes, 3rd party objects, remoting, and database queries for every single user visit across web, mobile web, and native apps. Dynatrace’s .NET capabilities include:
- Memory & Thread Diagnostics
- Logging & Exception Analytics
- Root Cause Identification with Method-Level Visibility
- CLR Health & Performance
- Automated Transaction Discovery, Mapping, & Monitoring
- Connection Pool & Database Usage per Transaction
In addition to robust .NET profiling capabilities, Dynatrace recently introduced a Sitecore Fastpack. The Dynatrace FastPack for Sitecore provides a preconfigured Dynatrace profile custom tailored to Sitecore environments. This FastPack contains sensors, a template system profile with measures and business transactions, dashboards for the Sitecore platform as well as a package for Sitecore to expose the rendering object names to Dynatrace.
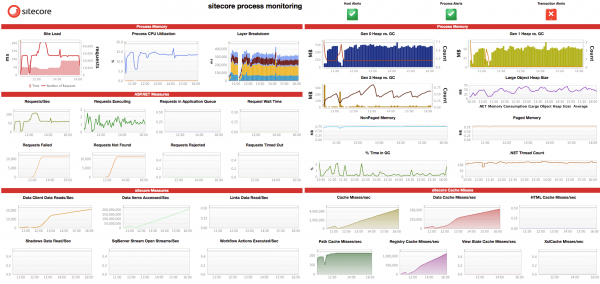
Dynatrace Sitecore Fastpack Dashboard shows many useful metrics including Load, Layer Breakdown, Heap & Thread Utilization, and Garbage Collection, plus Sitecore and .NET performance metrics
We quickly realized during our first run using Dynatrace that we were throwing too much traffic at the site. CPU was maxed at 100% for the entire duration of the load test. The profile results from the test were inconclusive because the application had already fallen over.
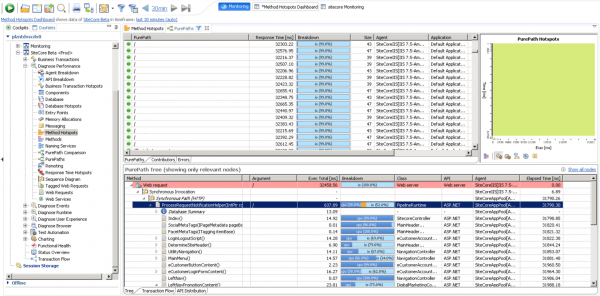
Under too much load, Dynatrace showed all of the time being spent in the web server (IIS). To avoid this, we needed to reduce load on the application.
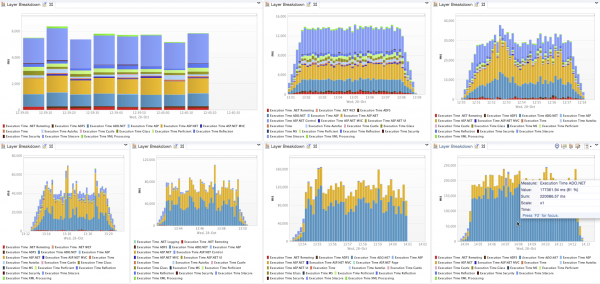
At this point, we realized that to get good results we needed to make the application “wobble” – enough traffic to stress the application but not too much to make it fall over. Once we did, we quickly discovered the bottleneck.
As you can see from the screenshots above, the bottleneck was ADO.NET, .NET’s database access layer. But why would a Sitecore application be limited by data access? What could cause this problem? Using Dynatrace’s path analyzer, we were quickly able to identify the code responsible for the database call and which controllers used the code.
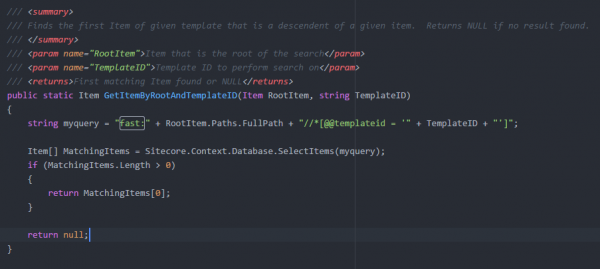
The offending code that uses FAST QUERY instead of using a more traditional method of accessing an item.
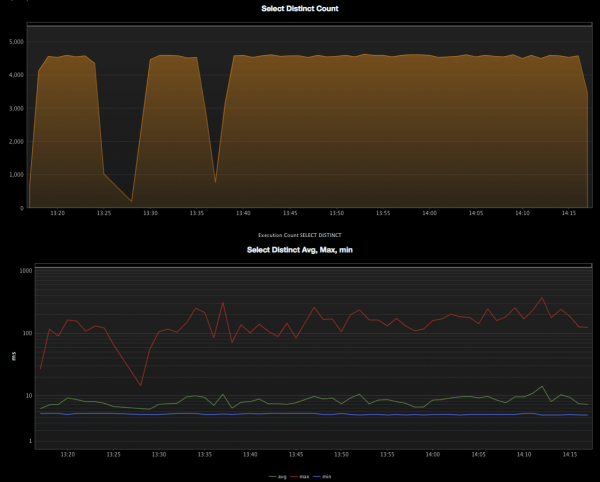
As you can see, the code uses Sitecore Fast Query to query the database for items of a particular templateid and then returns the first result. This particular piece of code was used in a number of controllers – including controllers responsible for rendering navigation components. Typically, when Sitecore retrieves an item, the result is cached in Sitecore’s data cache. However, Fast Query results are not cached. This meant a query to the database every time this piece of code was executed. Usually, Fast Query is pretty fast, but a SELECT DISTINCT query with three inner joins can only be so fast, especially when the SQL server is under heavy load. To re-engineer this code for performance, we chose to use a datasource (the retrieved item from the Fast Query) on the Sitecore rendering so that item is cached in Sitecore’s caching layer (the controllers retrieve a cached item rather than using Fast Query).
While fixing the fast query problem solved most of the glaring performance problems, we still weren’t getting the throughput we desired. We decided to turn HTML (output) caching on and the improvements were drastic.
Output caching increased throughput by 2.5 times and decreased SQL Server response time to 15ms. Output caching has a huge positive impact on performance so take a hard look at enabling caching everywhere you can in your Sitecore application.
Lessons Learned
- Fast Query isn’t fast Fast query is ok to use in isolated use cases or if the output (HTML) is cached. Otherwise, your SQL Server can quickly become a bottleneck under load. Remember that both Fast Query and Axes.GetDescendants() are not cached in the Sitecore data cache so using either of these methods always results in a query.
- Use Sitecore Datasource Don’t query for the item you need in your C# code. Instead, use datasource to point your rendering to the item it needs.
- Output caching makes everything really fast Using the output cache is highly recommended if performance is important (note: performance is always important). Any time you are writing code to look for a specific item in your tree, stop and think whether using datasource makes sense.
- When performance testing, discover the “wobble” point and use it Profiling an application that has already fallen over isn’t useful. Aim for 70%-80%CPU for the most meaningful profiler results.
- Use the best tools if you can. Without Dyantrace’s powerful profiling capabilities, we would have spent more time diagnosing the problems.
If you’d like a free 30-day test drive and more information on Sitecore Performance insights, please visit Dynatrace to download.

