I hope everyone has found my articles useful and have used my articles in creating some great looking SSRS reports. This week we will take a look at creating a product breakdown report or a detailed sales report.
Let us refresh our memory. Our sales table has the following fields:
| Fields | Description | Data Type |
| ID | Identifier (Primary Key) | Number |
| Product _Type | Candles, hand sanitizers, perfumes, etc | Varchar2 |
| Product Detail | Fragrance of the product such as Strawberry, Vanilla, Eucalyptus, etc | Varchar2 |
| In Store | Timestamp of the product arrival in store | Date |
| Sold | Timestamp of product sold | Date |
Imagine a scenario in which a manager wants a count of every product sold by its product type. We generate such a report by creating tabular reports and using SQL’s group by clause.
If you missed my article on creating tabular reports, don’t fret! This report will take you through the all the steps required to create a great looking sales report using tables in SSRS. This article will be a great refresher course.
The first step is to create a data source and this step will be common to all the reports I cover in my future articles.
Adding DataSource:
1.) Click on New and Select Data source:
2.) Enter name for your datasource. (Optional)
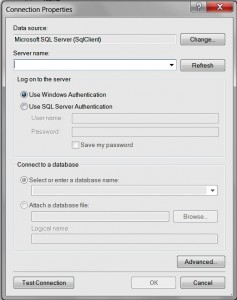
3.) Choose “Use a connection embedded in my report”
4.) Choose Connection Type
5.) Click on Build:
6.) Enter your username and password and Click on Test Connection.
7.) Click OK if you see the window shown below.
Let us add a dataset that can hold our SQL query.
Adding Datasets:
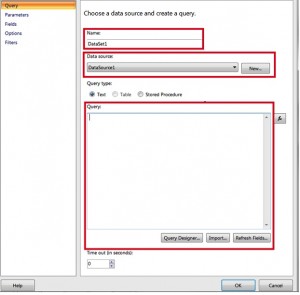
1.) Click on New and Select Data source.
2.) Enter a name for your dataset. (Optional)
3.) Choose Data source (In our case, it should be DataSource1 –if you haven’t renamed)
4.) Write your SQL Query.
Let us write our SQL query that will count the product_details for every product. I have also written the query in such a way that will return the count from highest to lowest (descending)
SQL query:
SELECT
[candle_soap_shop$].Product_Type
,[candle_soap_shop$].Product_Detail,
count(*)
FROM
[candle_soap_shop$]
group by [candle_soap_shop$].Product_Type
,[candle_soap_shop$].Product_Detail
order by count(*) desc
Now, that we have all the tools to create a great looking sales report, lets dive straight into it.
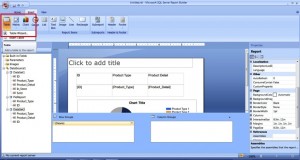
We will be using a table wizard to create the great looking report. To access the wizard, click on Insert and click on table wizard.
Next, follow the steps on the wizard.
My dataset for this report is called DataSet2, so I will choose that on the first screen.
Since, we want the report to be grouped by product or in other words, grouped by product row, drag product_type and product_detail under row group. Finally, drag the count to values field and click on Next.
Next page will show you a report layout. You must always verify that the layout matches your report requirements and if it does, click on Next. On the next page, SSRS will offer you several styles to apply to your report. I like blue color so I will go ahead and choose ocean.
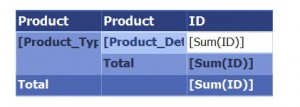
This report should be available on the canvas.
I am going to rename the field ID – Product Sold just because it is more descriptive. However, doing so is entirely your choice. Your report is ready to be viewed.
Stay tuned for more articles!


