The Frequencies command is one of the simplest yet one of the most useful descriptive techniques. Its objective is to simply sum the number of instances within a particular category.
For example, the following questions could be easily answered:
How many males and females make up my data pond?
What are the number of ethnic groups -Whites, Blacks, Hispanics, Asians, and others?
Of those who took the final exam how many earned A’s, B’s, C’s, D’s, and F’s?
Using the IBM SPSS Statistics Frequencies command, we can quickly see the following information:
- Value labels
- Value Code (the number associated with each level of a variable, e.g., female = 1, male = 2)
- Frequencies
- Percent of total for each value
- The valid percent (percent after missing values are excluded), and
- The Cumulative percent.
Let’s look at an example. Suppose we have a data pond resulting from an online survey. We see that one of the questions in the survey indicates if the respondent is married or not. We might want to use the frequencies command in SPSS to focus on this data point. From the Data Viewer menu, we select:
Analyze > Descriptive Statistics > Frequencies…
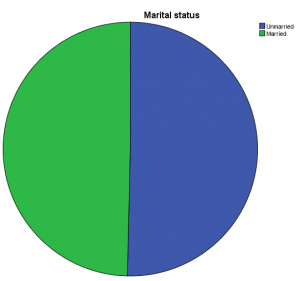
Using the Frequencies dialog I can select “Martial Status” from my list of fields and under “Charts” I can indicate that I want my data represented as a pie chart.
SPSS then gives us a standard frequency chart:
And the pie chart we requested as well (although as the frequency chart indicates, the data is pretty even which results in a kind of boring pie):
Ernest Hemingway once said “Every true story ends in death.” Well, this is a true story. –Brian’s song


