Next up in our series of cool things about analytics article series, is Unica’s Affinium NetInsight. This package is packed with power, yet is simple to use, is easy to install, and is also available on demand. To get a better understanding of some of the key capabilities of this tool, I spoke with Akin Arikan who is responsible for marketing Affinium NetInsight. So, without further ado here are 12 cool things you can do with New Insight.
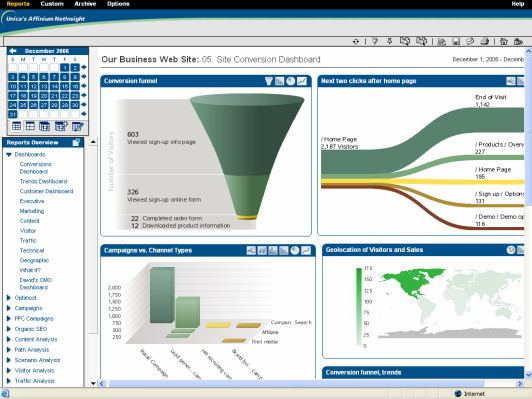
1. Creating custom dashboards: Affinium NetInsight makes it easy for you to set up custom dashboards for the key users of analytics data. Setup a report with just the basics for the CEO. Give him the dials and gauges he/she wants on the business, so they can sniff key problems and then tap someone on the shoulder to do something about it.
For the VP sales or sales manager, give him/her a dashboard focused on their current sales goals, so they can track their progress toward this month’s commission check. For the analyst, give him/her a much richer set of Key Performance Indicators on site performance, and towards other business goals. Better still, if you want, you can give multiple dashboards to each individual to fit their needs. Here is a look at a sample dashboard:
 |
2. Ad-Hoc Analysis: One great ability is to look backward in time at your data. One cool example of this is looking back in time to determine seasonal trends. What are the hot-selling seasons for your business? Or, break this down by product or service, to see if the selling seasons vary.
There are countless reasons why you would want to look back in time. One of the golden rules of analytics is that you have no idea what you don’t know when you start. High-value analytics is a journey, and it begins with a first step. After you take that step, you probably learn about more things you want to investigate. This will happen over and over again.
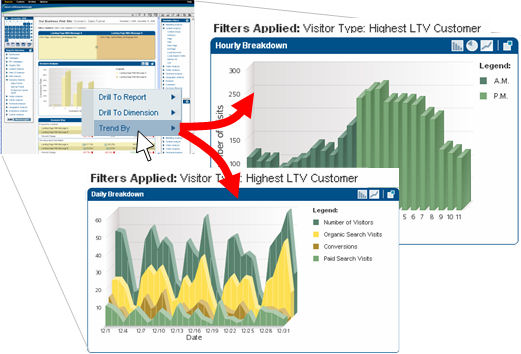
If you had to wait for new data to be collected every time you set up a new filter or segment, it would take a very long time to get your setup the way you need it. Even after you get your system set up perfectly, you will always come up with new questions you want answered right now. With Affinium NetInsight, you can perform new analyses on historical data quite easily. Here is a snapshot showing when most high-value customers came to a site:
 |
3. Drag, Drop, and Drill, Drill, Drill Down: Filtering is done easily within Unica’s Affinium NetInsight. It’s a drag and drop experience. You can also apply as many filters as you want simultaneously. Data is fed back to you in real time, so you don’t have to wait, and as we mentioned in the prior point, you can apply filters to historical data.
The program provides you access to a broad range of possible filters, such as time on site, location, order values, offline info, people who have been customers for 5 years. These are just examples, as there are tons of them. Here is an example of a scenario where the web analyst right clicked on a slice in the funnel to see both where high lifetime value visitors are located, and what keywords they came in on:
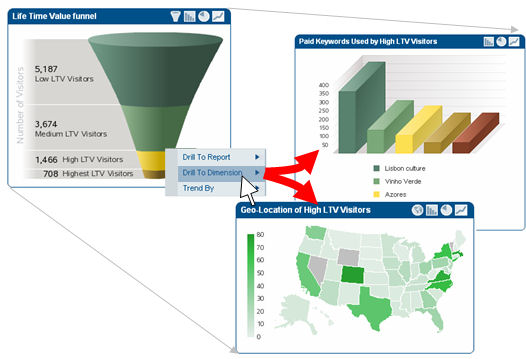 |
What would you do if you found out that the majority of your high-value visitors were coming on a certain set of keywords, and only from a certain area of the country? You just might be able to tweak your bidding strategy to optimize your results on getting more of these customers to your site.
4. Correlate Data: Another cool thing is the ability to correlate data. For example, you can go into your keyword report, and then drag a state filter into the report so you can see what states the keywords are coming from. Keywords are shown first, and then the states where the keywords are then shown second.
Don’t like that order? You can reverse it by dragging the state row over the top of the keywords, and the order is immediately reversed. Now the data will show the keywords per state. Then you can sort the data by conversion rate to see what state keyword combination are giving you the best results.
Another example is looking at the paid keywords report, and then looking at the actual search phrases to see what keywords you don’t like. This scenario, which is shown in the picture below, enables you to identify keywords that you want to negative match against in your PPC campaigns:
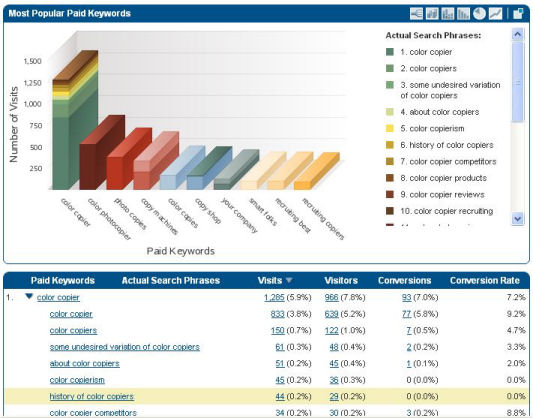 |
Note the “history of color copiers” keyword that is highlighted in the report. Looks like that’s one that this web analyst is going to add to the negative keyword list for his/her campaign.
5. A/B Analysis mode: In a conversation I had with Eric Peterson a couple of months back, one of the things he said to me stuck in my mind. To paraphrase it, he said that if you weren’t doing A/B testing, or multivariate testing, that you weren’t doing web analytics. There is no question in my mind that this is one of the highest value activities in web analytics, and Affinium NetInsight makes it very easy and very visual. Here is an A/B Testing screenshot:
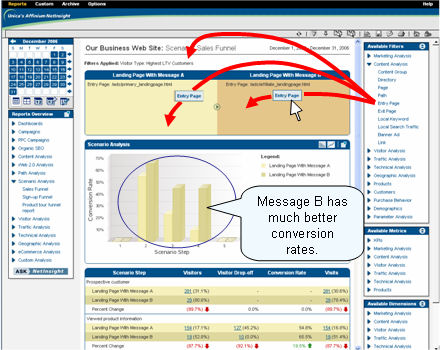 |
Notice how the screen is split up top to isolate the 2 scenarios, but then the bar charts have a highly visual side by side comparison of the scenarios. In this example, two different landing pages, with different messages, are being compared. Landing Page B looks like it performs much better. Doing these kinds of analyses, and finding these types of results, is money in the bank for your business.
There are many types of comparisons like this you can do. Here are just a few more examples:
- Find what keywords perform better on organic than paid
- Compare the behavior of new visitors v.s. returning visitors
- Compare the behavior of paid visitors with that of organic visitors
6. Integrate Offline Customer Data: One of the interesting things about Unica is that they did not start in the web analytics space, they began by focusing on the management and measurement of offline customer data. So Unica quite naturally brings a high level of expertise into thinking about how to integrate offline customer data with online customer data.
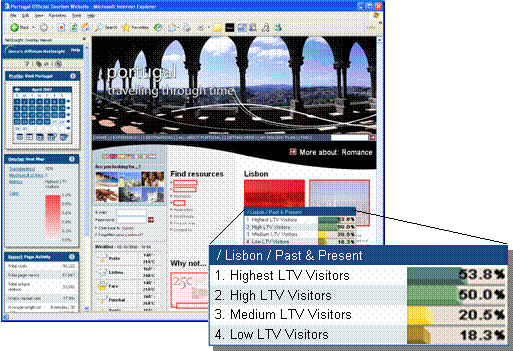
With Affinium NetInsight, you can segment your online reports using offline data. For example, you can examine the online behavior of all of your loyalty card customers. Or you can compare the behavior of your gold members with that of your bronze members. Or, as in this screenshot look at customer based on their lifetime value range, including both online and offline purchases:
 |
7. Examine Individual Click streams: Another neat thing about Affinium NetInsight is that you can review the detailed clickstream info on a user by user basis. Obviously, if you have lots of traffic every day, this is something you may not want to do to get the overall picture of what’s going on with your site. However, you can use this to sample specific customer transactions, and it can give you additional insight as to what is happening on your site.
In addition, if you have a B2B site, and the prospect is now calling into your sales line, it can provide a huge advantage if you can trace through their path on your site.
8. Robot/Spider analysis: The program allows you to implement your analytics using a combination of Javascript tagging on your pages and reading log files. What’s nice about the log file component is that it allows you to drill down into the behavior of search engine spiders on your website (you can’t get search engine robot data in a Javascript only implementation because the ‘bots don’t execute the Javascript).
Our first screenshot of this in action shows general robot data:
 |
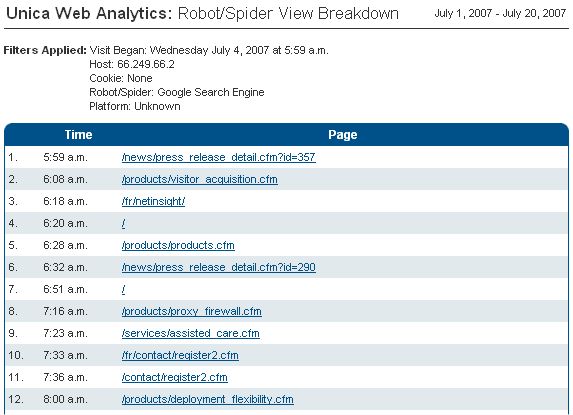
However, you can go quite a bit further than this. You can track the pattern of each bot in your site in detail. Here is a sample of what it looks like:
 |
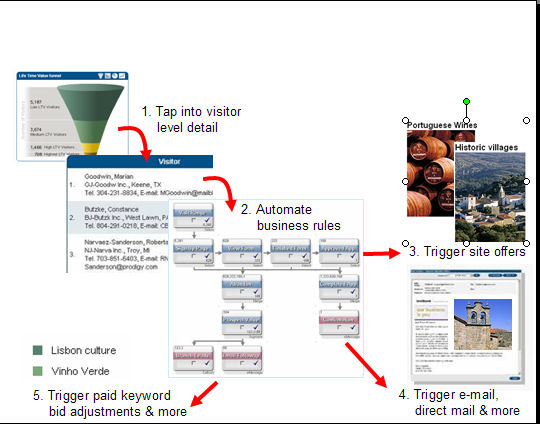
9. Remarketing: This feature allows you to take rapid direct marketing action. For example, if you have a visitor that is on your site, and starts to make their way down the purchase funnel, but they abandon it, Affinium NetInsight will allow you to drill down into the details of the user’s visit. You can then correlate this with your offline data, and if you have the e-mail address, you can automatically send them a special offer related to the product they were looking at.
This is a great example of turning “insight into action”. Here is a screenshot that provides a view of how this works:
 |
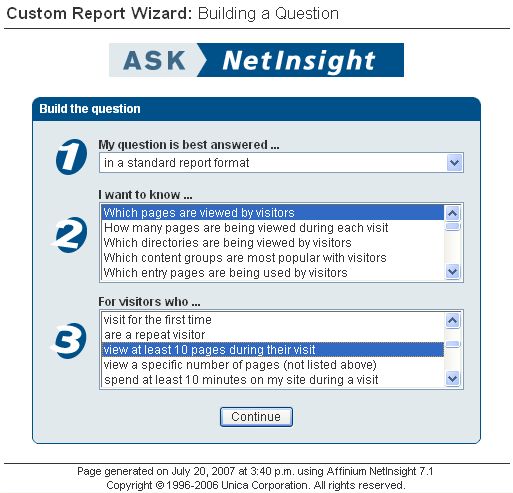
10. Ask NetInsight Wizard: Here is a cool feature – Can’t find out how to get the report you want? Just ask Affinium NetInsight. Tell it what report you want, and it will pull it together for you. You can pull from a pre-configured list of questions, or you can form your own custom questions. You can pick two different parameters for your report, as shown in the screenshot:
 |
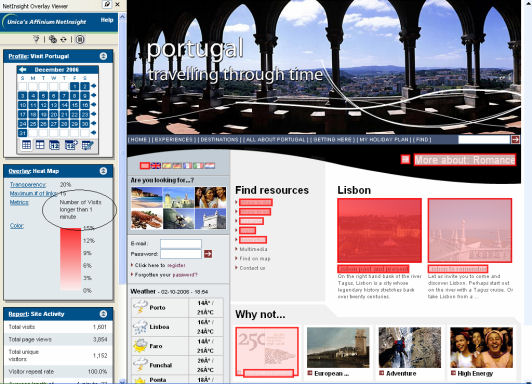
11. Heat Map Overlay: You want cool? Let me give you hot! Most analytics offer some type of Navigation Report or Site Overlay, that allows you to visit pages on your site within the tool, and see the aggregate behavior of people on that page, such as what % clicked through on what link. This is already a great concept. Affinium NetInsight takes this one step further by allowing you to add a heat map that highlights the behavior of a specific customer segment. You can apply these labels on the fly to the report. Here is a screenshot that shows a heat map for visitors who stayed on the site for longer than 1 minute:
 |
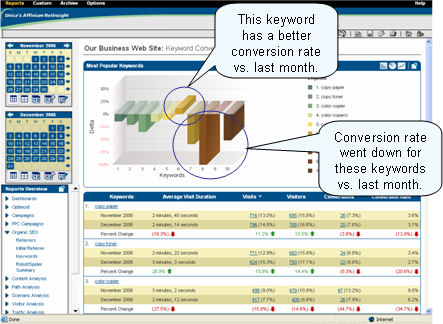
12. Date Comparison Reporting: This simple sounding feature is something that does not appear in many popular analytics packages. Yet it’s packed with powerful information. With Affinium NetInsight, you can quite simply compare the performance of one date v.s. another one. Here is what it looks like:
 |
Summary
That’s a beefy amount of capability for a single analytics package. Better still, the ease of use and installation is a big value too. You don’t have to tear your hair out figuring out how to do something, and that is worth a lot when you are trying to get an answer to a critical question. Very cool.
Have comments or want to discuss? You can comment on the Affinium NetInsight review here.
