Next up in our series of cool things about analytics article series, is Visual Sciences’ HBX Analytics. To help me learn the ropes of HBX Analytics, I had the capable help of Ali Behnam, who works in professional services at Visual Sciences. What you will see in the points below is a highly configurable application that will allow you to do tons of fun stuff.
1. Active Viewing:
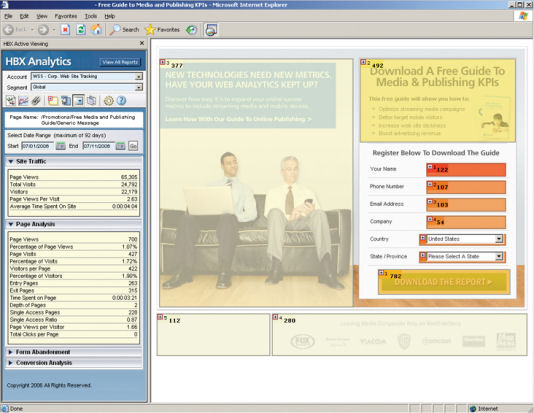
Most analytics packages offer a site overlay feature, one where you can see a view of the web page within your analytics software, and see the click-through rates on every link on the page. It’s a great tool for helping web designers figure out how to tweak their design for the best results. The link to the main action you want users to take getting fewer click-throughs than some other link on the page? Try moving the position around to see what happens.
HBX Analytics calls this feature Active Viewing, and the overlay tool in HBX is packed with exceptional power. Some of the unique features include:
- Ability to show click-through rates on links within DHTML menus
- You can overlay on top of a form
- Ability to overlay on top of Flash
- Use segmentation with your overlay to see the behavior of specific user groups.
The segmentation feature is cool because you can isolate specific personas (types of people) who come into your site and examine their behavior in detail. For example, you can isolate and examine the behavior of all users who came in on a search term that included the word “cheap” or “inexpensive”. Were these people simply bouncing because of sticker shock?
Or you can look at all the people who come in a search term that includes action words like “buy” or “purchase”. If these people are bouncing off your site in large numbers it spells real trouble, and it may mean that you make it too difficult for them to make a fast purchase. Perhaps you are providing too much information up front when they want to just get the purchase done.
In any event, here is a screenshot that shows the website on the right, and some stats on the page on the left:
 |
2. Customizable Dashboards:
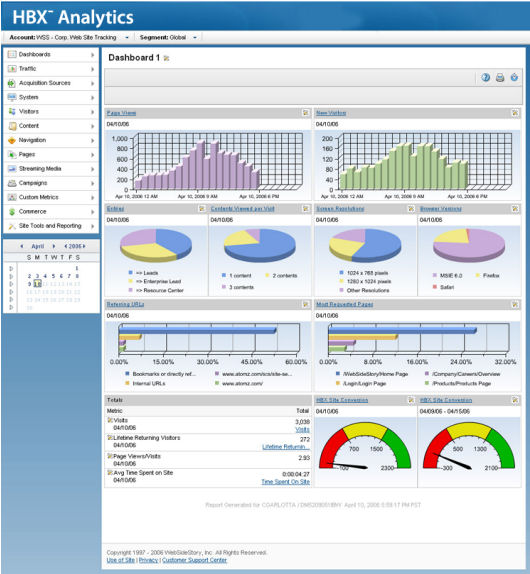
HBX offers great capabilities for implementing customizable dashboards. Basically, this feature allows you to offer your CEO one view of the world, your VP of Sales a different view, and your business analyst a different view altogether. Senior management will normally just want to get a snapshot of the key metrics and key performance indicators (KPIs) for the business with a minimum of muss and fuss. HBX also lets you make this a highly visual experience:
 |
3. Navigate the Funnel:
One of the most basic processes in web analytics is a funnel. Funnels are used to measure user progress through the steps you want them to take, such as with a shopping cart. The classic funnel looks similar to this one here:
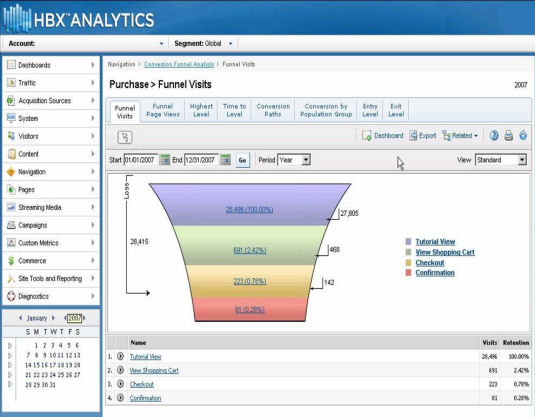 |
Users essentially enter the funnel at the top and progress down through the funnel. Each stage down gets a bit narrower because some of the users drop off at every step. The basic funnel is cool because if you see an excessive fallout level between one stage and another, it may be an indicator of a design problem. Perhaps the user isn’t seeing what they are expecting at a given stage and are simple bailing out. Funnels are a great tool for uncovering that.
The funnel in HBX Analytics is cool because you can set up your funnels for any kind of process on your site, not just a shopping cart. For example, you can build a funnel that treats all the top landing pages on your site as the top part of the funnel, all your product pages as another stage, and then drops into your shopping cart from there. This can be done within the UI for many cases, but for more complicated sets of stages, you can take this even further by doing on page tagging of all the pages you want to treat as one stage in the funnel.
Now you can see how your landing pages are performing in the context of your website goals. Are your pages highlighting the right products? Is the call to action working? Does one landing page perform better than another? All easy to see through the power of a loosely defined funnel.
4. Capturing Attribute Data:
Visual Sciences offers a Site Search capability that is a separate product offering from HBX Analytics. However, the two tools are neatly and easily integrated. For example, if you have a site that is selling shirts, you can define a set of attributes for those shirts. For example: mens or womens, shirt color, shirt size, shirt style, etc.
By tagging the corresponding pages with the attributes appropriate to those pages, you provide HBX with a wealth of new data that can be analyzed. Using this data allows you to find scenarios where people are searching for products that you don’t carry. If enough of them are looking for such a product, and it’s easy for you to add to your product line, then do it – easy additional revenue.
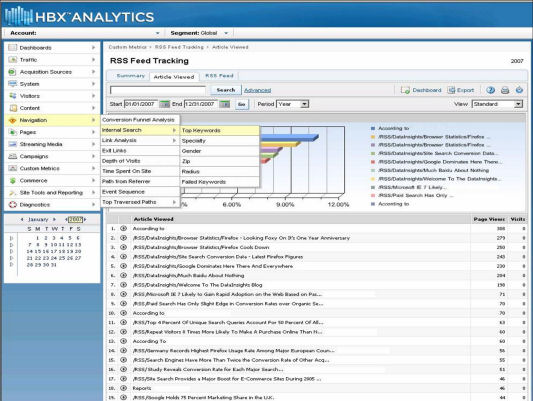
Or, you can implement a feature: “Related Searches: people who searched for this also searched for …”. This type of shopping navigation tool has been proven by many businesses to offer a tremendous amount of value to the shopping experience, and increase sales. There are many, many more types of things you can do with this type of insight into custom behavior on your site. Here is a sample screenshot:
 |
5. Filtering Conversions:
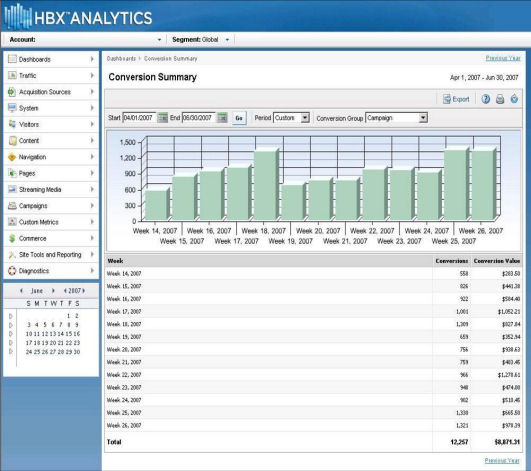
Next up on our hit parade is the ability to filter on conversion type. This is really cool, because now you can break down the behavior of people on your site based on the type of actions they take. Here are some examples of types of conversion scenarios that you can look at:
- By family of product purchased
- Newsletter signups
- Contact us requests
- Lead generation, perhaps segmented by lead type
- Commerce type, e.g. enterprise or SMB?
With HBX you can drill down and track the behavior of visitors on your site based on any conversion type you decide to define as a separate conversion group:
 |
6. Active Segmentation:
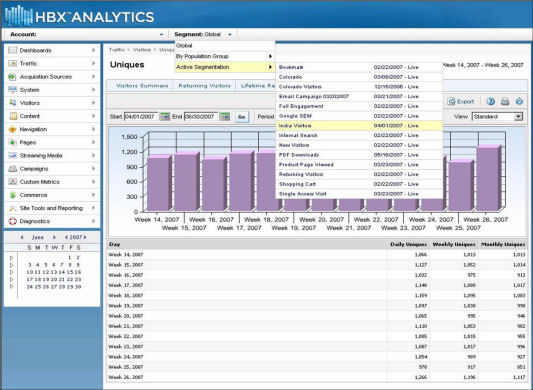
User segmentation is one of the basics of web analytics as well. Basically, segmentation allows you to analyze the behaviors of groups of visitors separately. For example, you may want to treat all first-time visitors as one segment, and people who have previously purchased a product as another segment. These segments are easily defined in the Administration section of HBX.
What makes this feature in cool in HBX, is the ease with which you apply segments. On any report, if you want to look specifically at the behavior of a segment of users, it’s easy. Just use the drop down at the top of your screen as you can see in this example:
 |
Very cool.
7. Custom Metrics:
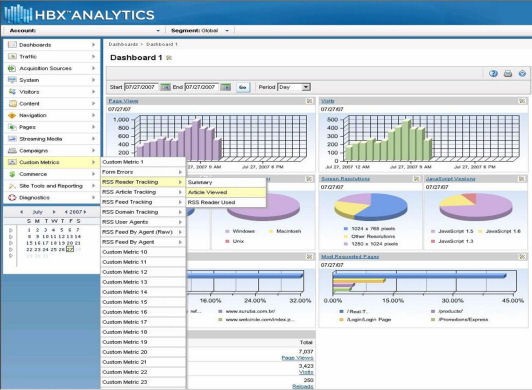
While there is tons of segmentation, filtering, and slicing power already in HBX, sometimes you just need to trigger on your own custom defined metrics. And you can do it. For example, perhaps you want to do your own RSS tracking in HBX. Setting this up would require some communication with Visual Sciences professional services, but once it’s done you’ll be able to pick your Custom Metrics from HBX as follows:
 |
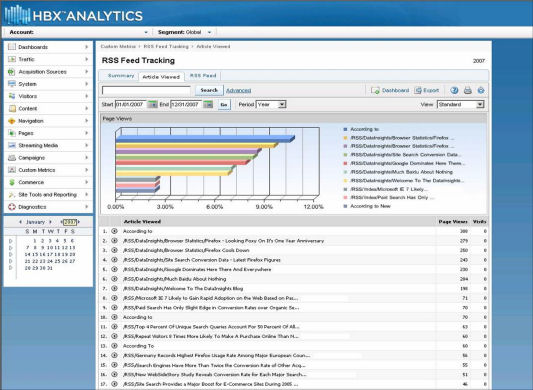
Then, quick as a snap, you have got access to the custom information you need. Here is how it looks for our RSS feed example:
 |
8. Campaign Attributes:
Think we’re done with slicing and dicing your data? Not quite yet. Another scenario you may want to key in on are campaign attributes. In this context, a campaign can be anything you are doing to bring in traffic. A campaign attribute relates to various aspects of that campaign. Here is a list of some campaign types and their attributes:
- Banner Ads
- Banner size
- Banner color
- Banner message
- E-mail
- Link position in an email
- Keywords
- Organic keywords
- Paid keywords
- Newsletter
With HBX you can isolate any of these types of campaign attributes and see their impact on your overall results. For example, with regard to the link position in an email, one simple metric you can track is the effect of the link position in the email on the click-through rate.
9. Report Builder:
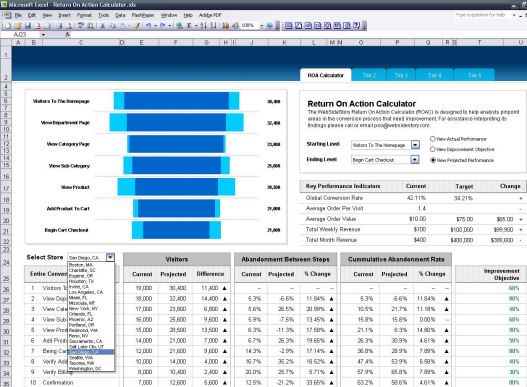
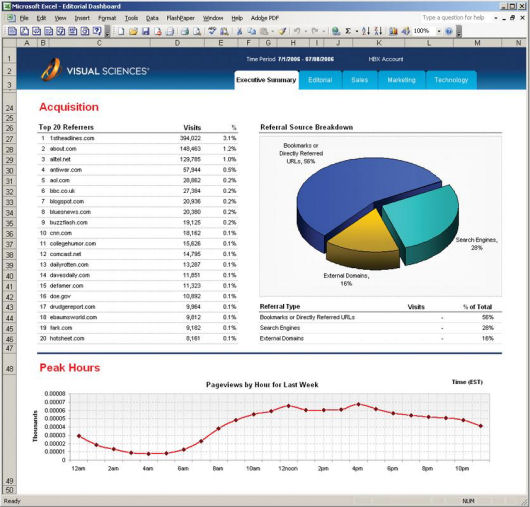
Here is one of the true gems of HBX. It is an add-on module, but it’s easily added, and the power it provides is just phenomenal. Report Builder is an Excel plug-in that allows you to draw data from HBX directly into Excel, and then manipulate it any way you want (as you would with any other data in Excel).
Sounds pretty cool, right? Well, we are only halfway there. You can set your spreadsheet up with Report Builder to automatically update with the latest data, without any further action by you. Here is an example of a spreadsheet built dynamically using Report Builder:
 |
For good measure, here is another one:
 |
This isn’t just cool. It’s hot.
10. Active Dashboard:
Sometimes you want to be able to provide a simple technique to see the impact of various “what if” scenarios. This is where HBX’s Active Dashboard capabilities come into play. For example, Active Dashboard allows you to integrate flash directly into a Powerpoint presentation as shown in the following screenshot:
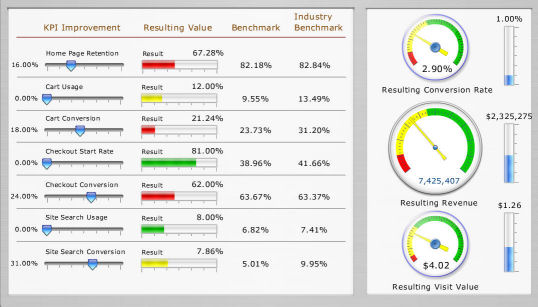 |
Think those sliders are just part of the pretty picture? Think again. Drag them to the left or the right and all the other data dynamically updates. What a great way to model business scenarios for your senior management team.
Note that this also requires a bit of setup, due to its inherently custom nature. The steps you need to take are to determine the KPIs you want to highlight, define the dependent and independent variables, define what the audience should be able to control, and get a little help from Visual Sciences professional services to get it up and running. But there is surely a lot of power in the results!
11. APIs:
One of the nifty things about HBX is that it gives access to the data in any number of ways, including Active Viewing, the HTML user interface, Report Builder, Active Dashboards and a Web Services API. This is, in fact, the basic capability that drives both Report Builder and the Active Dashboard. Extracting live data into other applications provides you with an awesome range of possibilities. Here are a couple of ideas just to whet your appetite:
- On an eCommerce site make a determination within HBX of what product is providing the best results. Then export that data through the API into the web application which can then dynamically move the best selling (or best margin) products to the top of the page relevant to those products on the fly.
- If you are running a media site, and you want to have a list of the top 10 articles of the day, it’s easy. Just use HBX to determine the most popular articles, have your CMS extract the data through the API, and then have your web application push the list out on the fly.
There are really many, many more possibilities for using the API to make things happen on the fly.
Summary
At the heart of HBX is a whole lot of power that will allow you to do things dynamically, and slice and dice data in an extraordinary number of ways. It’s cool to think about the number of things you could possibly do with it. For some of the features there is some additional setup required, but oh, the power.
