
1. Functional Test Coverage
Requirement coverage is always used to track test case design quality, but this traceability can’t get the coverage of acceptance criterion in code. After the test case execution, how many branches or lines of code are executed? How do you improve test cases or test data design with quantified indicators? Functional test execution is often black box testing.
In this paper, you will learn how to track the code coverage of a functional test, so that the test design and execution can be refined to reach an accurate, functional test goal.
2. Collect Code Coverage
Functional test code coverage can be accumulated during test sessions triggered from the interface and UI. A tester can get coverage of the target classes dynamically and check for missed scope anytime and then review the test case or test data to include more scenarios while removing redundant tests at the same time. Low code coverage can indicate that the test scope can’t reach a quality goal, so it can be considered a quantified indicator to evaluate quality.
The popular tools to get code coverage for an integration test are Emma, Jacoco, Sonar, Cobertura, dotCover(.NET) and so on. Jacoco is a java code coverage tool and will be used as our example, as it has many functions and is continuously upgraded. Jacoco instrument java classes in the server with java byte code and its workflow is shown in figure 2.
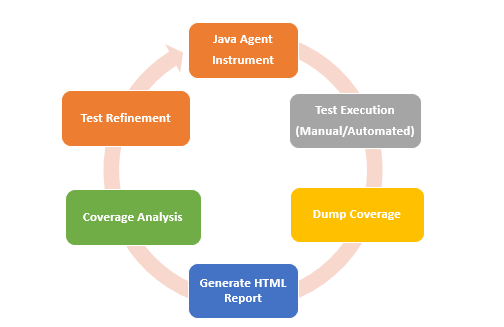
Figure 2 Workflow of On-the-fly mode
On-the-fly and offline mode can be used for instrumentation. On-the-fly mode is recommended because it is more convenient and there is no limitation to classpath configuration. On-the-fly can be used when the java agent is allowed to run in JVM. The java agent can be configured in catalina.bat as below. The Java agent can also be replaced by maven. Start agent, then code coverage is under listening and saved in the EXEC file.
JAVA_OPTS=”-javaagent:%CATALINA_HOME%/jacoco/lib/jacocoagent.jar=includes=*,output=tcpserver, address=10.2.1.122,port=8080
3. Code Coverage Analysis
An html report can be generated from the EXEC file by using the maven plug in jacoco-maven-plugin.
Five indicators can be analyzed with the Jacoco report, including instructions (C0), branches (C1), lines, methods, types and cyclomatic complexity as shown below. Branches and complexity are the main indicators that the tester needs to pay attention to. Cyclomatic complexity refers to the minimum number of paths that can, in (linear) combination, generate all possible paths through a method. Missed complexity is also an indication to fully cover a module. Complexity often has lower coverage than other four indicators.
Although coverage counters are important, the tester needs to focus more on analyzing missed code with developers together. For instance, four test cases were created for a resume reader user story. The BaseSheetReader class contains key logics for realizing functions. The overall coverage of this class is show in figure 3. Check to make sure the coverage of every method, and the complexity and branch coverage of the method getSheetType is only 50% and 67% as in figure 4. Uncovered lines and branches are highlighted in red and yellow as in figure 5.
From the report, only 1/3 of total branches were covered during the functional test. The tester needs to compare the acceptance criteria of a user story, and update the test steps to cover different sheet type and process exception scenarios. The test steps and test data have to be followed exactly during execution, otherwise missed steps can still be tracked in the coverage report.

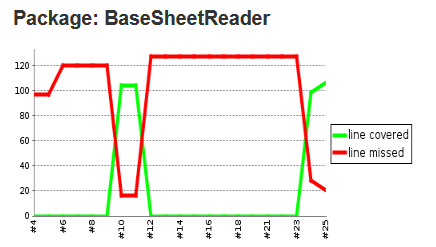
Figure 3 Overall Coverage of Class
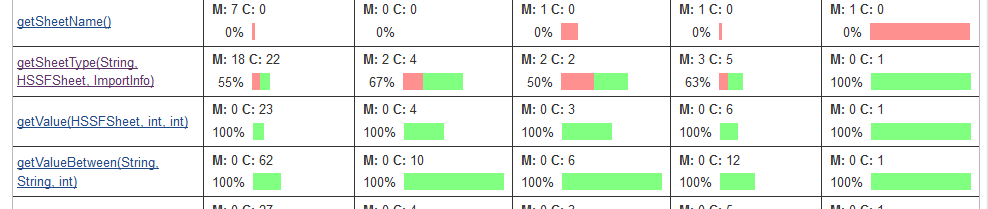
Figure 4 Coverage of Methods

Figure 5 Code Analysis
Unit test coverage can also be calculated by Jacoco, and exec files can be merged for the unit test and functional test by jacoco-maven-plugin:merge. Then the tester can focus more on missed branches by all tests and treat them as a higher priority.
4. Conclusion
After implementing Jacoco in the project, the tester can locate uncovered logic accurately, and it is easier to track the quality of the test design and execution. The coverage of targeted packages improved from 16% to 67% so far. Some best practices can be summarized for reference:
1. Targeted classes files for report and application have to be generated from the same JVM.
2. Filter out package and classes if they should not be tracked.
3. Test coverage need to be tracked during the first round of execution.
4. Code analysis is more important than the overall coverage indicators.
5. Tester and developer need corporate to finish code analysis.
6. Traceability of acceptance criteria and code coverage need to be analyzed together.
Reference
http://www.eclemma.org/jacoco/
https://wiki.jenkins-ci.org/display/JENKINS/JaCoCo+Plugin