
Debugging modern web applications can be a challenging task. Redux DevTools is an excellent tool for tracking state changes and dispatching actions in Redux applications. Combined with source maps in Webpack, you can easily trace back to your original source code, making debugging much more straightforward. In this post, we’ll walk through setting up Redux DevTools and enabling source maps in Webpack.
Step 1: Setting Up Redux DevTools
First, let’s integrate Redux DevTools into our Redux application.
Install the Redux DevTools
npm install --save redux-devtools-extension
Configure your store to use Redux DevTools
import { createStore } from 'redux';
import { composeWithDevTools } from 'redux-devtools-extension';
import todoReducer from './reducers';

const composeEnhancers = composeWithDevTools({
  trace: true,  // enable tracing
});

const store = createStore(todoReducer, composeEnhancers());
export default store;
If you have middleware to apply, you can integrate Redux DevTools with ‘applyMiddleware’:
import { createStore, applyMiddleware } from 'redux';
import { composeWithDevTools } from 'redux-devtools-extension';
import thunk from 'redux-thunk';
import rootReducer from './reducers';

const store = createStore(
  rootReducer,
  composeWithDevTools({
    trace: true, // enable tracing
  })(applyMiddleware(thunk))
);

export default store;
In this setup, ‘composeWithDevTools’ integrates Redux DevTools with our store, enabling us to monitor actions and state changes.
Step 2: Enabling Source Maps in Webpack
To make our debugging process smoother, we can enable source maps in Webpack. Source maps allow us to see the original source code rather than the minified and bundled code when debugging in the browser.
Update Webpack Configuration
By adding ‘devtool: ‘source-map’, Webpack generates source maps that help you trace back to the original source code when debugging.
const path = require('path');

module.exports = {
  entry: './src/index.js',
  output: {
    filename: 'bundle.js',
    path: path.resolve(__dirname, 'dist')
  },
  module: {
    rules: [
      {
        test: /\.js$/,
        exclude: /node_modules/,
        use: {
          loader: 'babel-loader',
          options: {
            presets: ['@babel/preset-env', '@babel/preset-react']
          }
        }
      },
      {
        test: /\.css$/,
        use: ['style-loader', 'css-loader']
      }
    ]
  },
  devtool: 'source-map',
  devServer: {
    contentBase: './dist',
  },
};
Step 3: Using Redux DevTools

Once you have set up the Redux DevTools, you can start using it to debug your application:
-
Open the Redux DevTools extension in your browser
-
- In Chrome, you can find it under More Tools > Extensions > Redux DevTools.
- In Firefox, it will be available as an icon in the toolbar.
-
Monitor Actions and State Changes
The Redux DevTools extension provides a detailed view of actions and state changes:
-
- Action List: View the list of actions dispatched in your application.
- State Tree: Inspect the current state tree after each action.
- Action Payloads: View the payloads of each dispatched action.
- Time Travel Debugging: Jump between different states in your application’s history to see how state changes over time.
- Dispatch Actions: Manually dispatch actions to see how the state changes.
- Use Features Like Log Monitor, Chart Monitor, and Inspector:
-
- Log Monitor: Provides a console-like experience with logged actions and states.
- Chart Monitor: Visualizes the state tree as a chart.
- Inspector: Offers a detailed view of the current state and diff between states.
In large-scale applications, where the same actions are triggered simultaneously from various parts of the app, pinpointing the root cause of an action dispatch can be challenging. This is where the trace feature becomes invaluable for developers.
Tracing actions in the editor
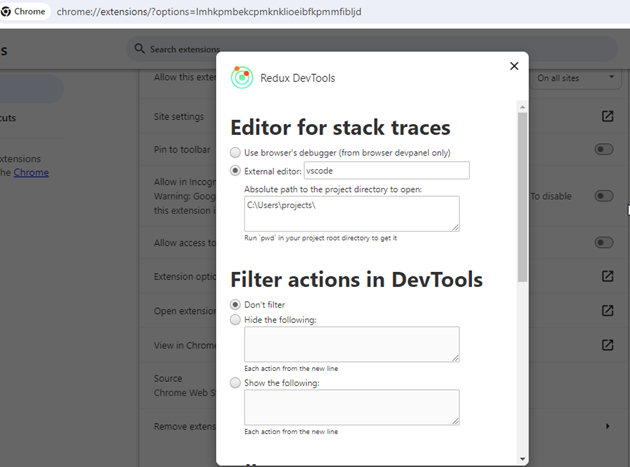
Redux DevTools enhances the ability to trace actions by allowing you to navigate directly to the specific point in the codebase where an action was dispatched. This is particularly useful for large codebases, as it saves significant time by quickly locating the exact spot in the code. You can configure the editor from the extension settings:
- Add the required editor you want to debug the application in the External Editor.
- Update the absolute path of the project.
Example Settings:
Go to the Redux DevTools and check for the dispatcher in the Trace. Click on the required dispatcher, and it will direct you to VSCode once you have configured it correctly.
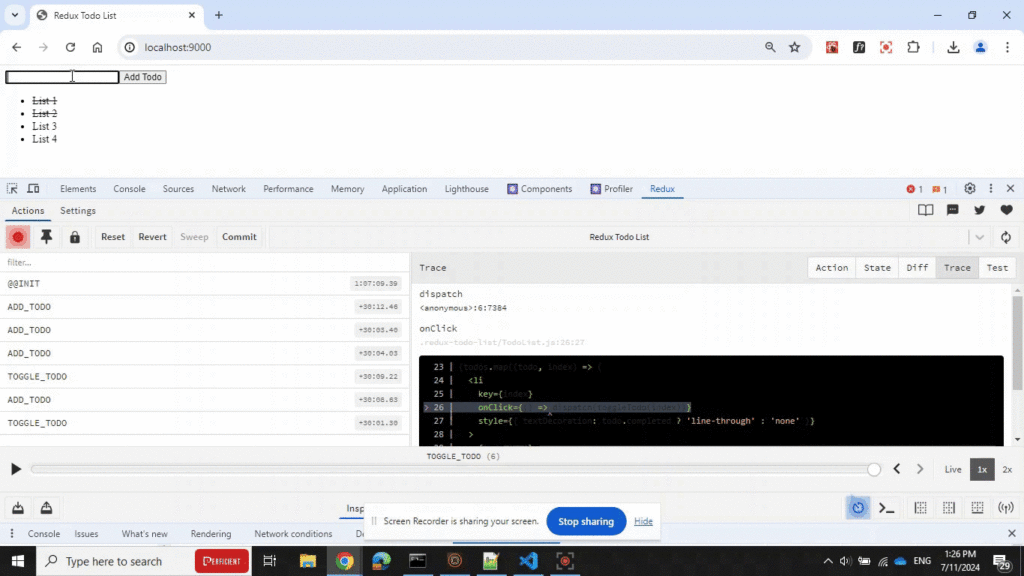
Gif image showing how to trace the application using Redux DevTools in VS Code.
Conclusion
By integrating Redux DevTools and enabling source maps in Webpack, you can significantly improve your experience debugging Redux applications. Redux DevTools provides a powerful interface for tracking state changes and actions. At the same time, source maps allow you to trace back to the original source code, making it easier to identify and fix issues in your application.
With these tools in your arsenal, you’ll be well-equipped to handle even the most challenging debugging tasks in your Redux applications.