
When working with Selenium WebDriver to automate web testing, debugging can be a challenging task, especially when dealing with JavaScript errors that occur within the web application you are testing. To aid in debugging, it’s essential to capture and log JavaScript errors from your Selenium scripts to the browser’s console. In this blog post, we will explore how to achieve this effectively.
Why Logging JavaScript Errors Is Important
Logging JavaScript errors is crucial for several reasons:
- Debugging: JavaScript errors can be elusive and challenging to identify. Logging them allows you to pinpoint the exact error message, location, and context, making debugging more manageable.
- Error Tracking: By logging errors, you can track the occurrence and frequency of specific errors over time, helping you identify recurring issues in your web application.
- Real-time Monitoring: Logging errors to the browser’s console provides real-time visibility into issues that might affect your users. This proactive approach helps you catch and fix problems before they impact your users’ experience.
How to Log JavaScript Errors from Selenium
To log JavaScript errors from a Selenium script to the browser’s console, follow these steps:
- Set Up Selenium WebDriver
Before you can log JavaScript errors, you need to set up Selenium WebDriver with your preferred programming language (e.g., Python, Java, JavaScript) and browser (e.g., Chrome, Firefox).
- Execute JavaScript to Capture Errors
Use Selenium’s method to execute JavaScript code within the browser. In this code, you’ll set up an error handler that logs errors to the console. Here’s an example in Java:
import org.openqa.selenium.WebDriver;

import org.openqa.selenium.chrome.ChromeDriver;

import org.openqa.selenium.logging.LogEntries;

import org.openqa.selenium.logging.LogEntry;

import org.openqa.selenium.logging.LogType;


public class JavaScriptErrorLoggingExample {

    public static void main(String[] args) {

        // Set the path to the ChromeDriver executable (Download and configure WebDriverManager for a more dynamic setup)

        System.setProperty("webdriver.chrome.driver", "path/to/chromedriver");

        // Initialize the WebDriver (in this case, ChromeDriver)

        WebDriver driver = new ChromeDriver();

        // Navigate to a webpage

        driver.get("http://the-internet.herokuapp.com/checkboxes/");

        // Capture browser logs of type "BROWSER"

        LogEntries browserLogs = driver.manage().logs().get(LogType.BROWSER);

        // Iterate through the log entries and print the messages

        for (LogEntry entry : browserLogs) {

            System.out.println(entry.getMessage());

            // You can also perform further actions with the log data here.

        }

        // Close the WebDriver when done

        driver.quit();

    }

}
Output:
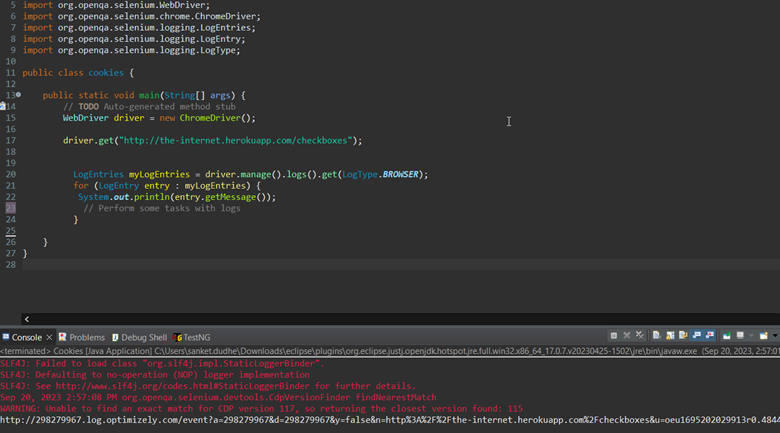

fig: selenium code with logs.
In this Java example:
We initialize the ChromeDriver by setting the path to the ChromeDriver executable. You can also use WebDriverManager to dynamically manage the driver.
Created a WebDriver instance (driver) for the Chrome browser.
System.setProperty("webdriver.chrome.driver", "path/to/chromedriver");
// Initialize the WebDriver (in this case, ChromeDriver)
WebDriver driver = new ChromeDriver();
We capture browser logs from type LogType.BROWSER using driver.manage().logs().get(LogType.BROWSER).
// Capture browser logs of type "BROWSER"
LogEntries browserLogs = driver.manage().logs().get(LogType.BROWSER);
We iterate through the log entries (browserLogs) and print the log messages using entry.getMessage().
for (LogEntry entry : myLogEntries) {
        System.out.println(entry.getMessage());
    // Perform some tasks with logs
}
Inside the loop, you can add further logic to analyze or perform actions based on the log data.
When you run this code, it will open webpage, capture any JavaScript errors or other logs in the browser, and print them to the console.
- View the Console Output
After running your Selenium script, open the browser’s developer tools (right-clicking and selecting “Inspect”) and navigate to the “Console” tab. You should see the JavaScript errors logged there.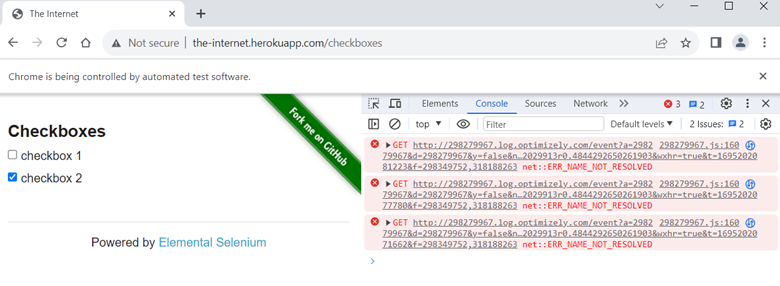
fig: console logs.
- Analyze and Debug
With the JavaScript errors logged to the console, you can analyze the error messages, trace the source of the issues, and use this information to debug and fix problems in your web application.
Conclusion
Logging JavaScript errors from your Selenium scripts to the browser’s console is a valuable technique for effective debugging and monitoring of web applications. It allows you to catch and address issues promptly, leading to more reliable and user-friendly web applications. Incorporate this practice into your Selenium test automation workflow to enhance the quality and stability of your web applications.