As a part of my role, I am responsible for maintaining uptime for giant e-commerce web applications and their infrastructures. Whenever any issue occurs on the live e-commerce web application, we need to collect infrastructure and application logs, which provide us with information about the issue. We then analyze the logs and perform the appropriate steps to fix the issue.
For any e-commerce web application, its uptime is directly proportional to actual business. It is always good to have early issue diagnosis, automated alerting, and fix applying mechanisms in place for maintaining better uptime of your e-commerce website. Systems that implement such mechanisms are called monitoring systems.
When you need to perform such diagnoses, alerting, and issue fixing on a large-scale e-commerce web application environment, it becomes crucial to have automation implemented for these steps within your monitoring system.
For example, when the 80% CPU utilization threshold for your e-commerce web application server has been crossed, your monitoring system, thanks to automation, will fire an email alert and trigger a script-based Jenkins job, which will collect a detailed report of the server’s current performance and email that report to the necessary teams.
Now that you have a basic understanding of the information, monitoring, and automation I’m talking about, let’s dive deeper into how to use a monitoring system effectively.
Monitoring Systems: Why, How & What?
Your systems are talking, but have you tried listening to them?
Why should you listen?
Your systems may be saying “Hey, I am currently running with 8% CPU and 40% Memory,” and so on. The information they are telling you can often provide possible symptoms and indications of an issue or anomaly.
For example, let’s say you are listening (monitoring) to a system that usually says “Hey, I am currently running with 8-15% CPU, 40% Memory,” but suddenly it started saying “Hey, I am currently running with 88% CPU, 40% Memory.” Here, this 88% CPU indicates an anomaly. Similarly, this kind of listening can sometimes provide you with indicators of a compromise to your system, which would be very useful information indeed.
How should you listen?
It’s true that systems are talking and listening to them helps admins do their job. But trust me, they talk a lot. It’s not practical to constantly listen to the systems by opening the task manager/top command and continuously looking after it. For this, you will need a centralized location to store the information so you can analyze the data on a regular basis. This is done with monitoring systems.
What should you listen to?
Now, let’s say you are sending the data to a centralized form to be reviewed. What if a sudden CPU usage hike has caused a website outage on Thursday morning and you are reviewing this data on Thursday evening, per your regular practice of reviewing the data every evening?
Here comes the role of automation in the form of alerting. In your monitoring system, you can set up alerts based on various conditions. In the above scenario, you could have an alert set to trigger a warning email to you whenever the system crosses 80% of the CPU usage threshold.
How Monitoring Systems Work
The standard monitoring system workflow requires three main components.
1. Monitoring agent component: Deployed on the end systems, it collects metrics and logs and forwards them to the centralized database (DB) system.
2. DB system component: Deployed on the centralized server, it collects data from the monitoring agent and stores it in the required DB format.
3. Visualization component: Deployed on the centralized server, it provides a web-based visualization interface to the system admins. It collects the data from the DB system and presents it in graphical format.
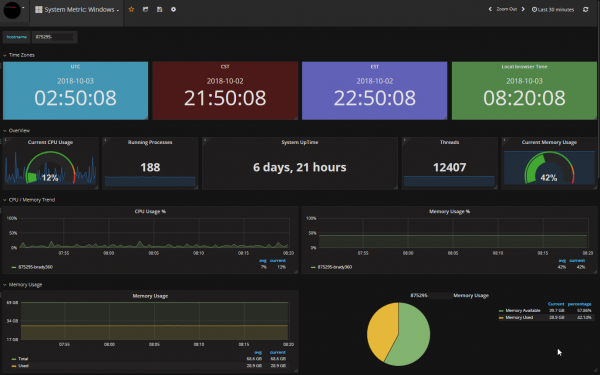
Monitoring system first look
Our Monitoring System Implementation
Our monitoring system uses Telegraf as the monitoring agent for collecting performance data from devices and fetching it to the centralized DB, which is called InfluxDB. This centralized data is then available to users in an easy-to-visualize form via a web-based portal component called Grafana. The graphic visualizations are formed using SQL (Structured Query language) like background queries.
1. Telegraf: Telegraf is cross-platform, involves negligible resource consumption, has built-in modules for various system/application metrics like Apache, MySQL, MongoDB, Nginx, MSSQL, etc., and is highly customizable through plugins and custom shell/batch/PowerShell scripts.
2. InfluxDB: InfluxDB utilizes very few resources compared to its alternatives, and it supports SQL like queries, which led me to choose it over other options.
3. Grafana: For metric/log visualization dashboards, Grafana is the preferred choice of many, as it provides a portable web interface and is a cross-platform system. Grafana currently has the highest number of possible integrations compared to alternatives.
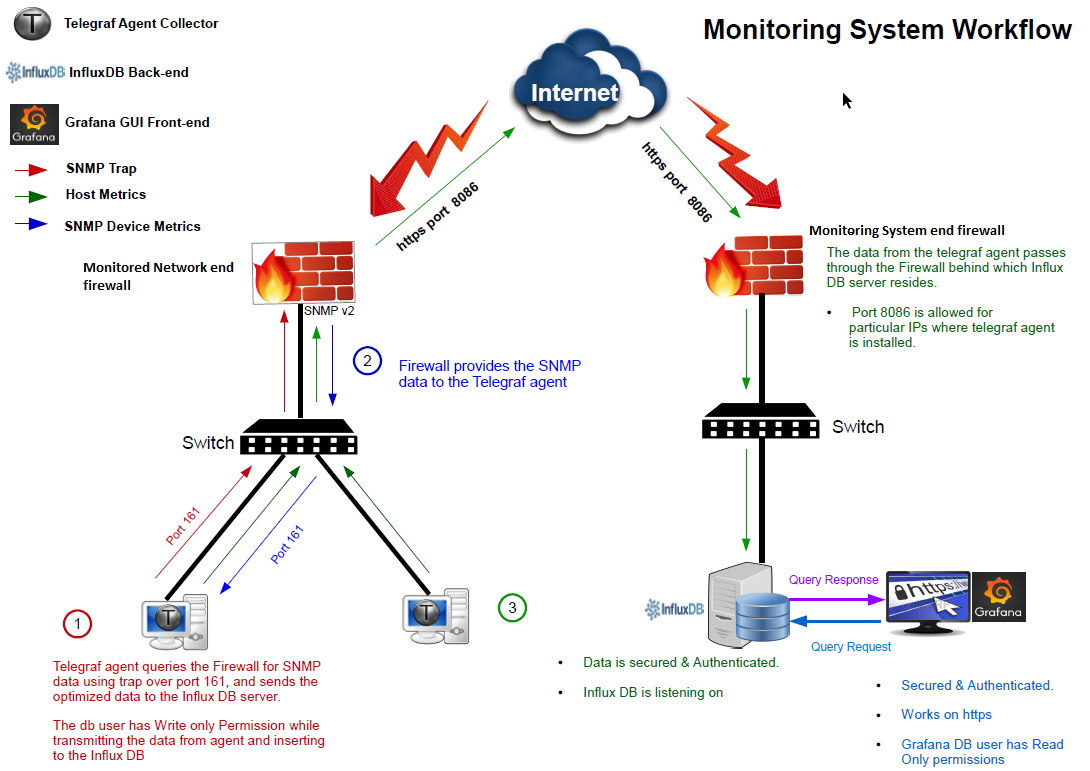
Monitoring system workflow
While architecting and deploying our monitoring system, we have followed various best practice measures, a few of which are listed below. These measures make deployment simple, secure, and powerful.
Data collection method
We have used the push method to collect the data in the DB system, making it simple to manage the whitelisting of monitored devices at a single firewall, which belongs to the monitoring system’s server network. Also, for pushing data, we used a DNS name which will keep the system intact during IP change/migration activities of the DB server.
HTTPS encryption & other encryption

Traffic for both the centralized systems, InfluxDB and Grafana, flows through an HTTPS Encryption. For collecting network devices data, we are using an encryption-supported version of SNMP (Simple Network Management Protocol).
Secured deployment
Deployment of our monitoring system is very secure. We have applied fixes for various known vulnerabilities during its deployment. We have performed vulnerability scans on it several times and received a compliant report.
Optimized performance
Our monitoring system is optimized by implementing GTmetrix best practices.
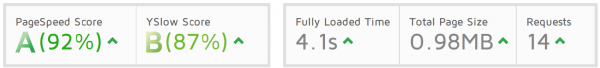
Page score from GTmetrix
Enterprise user experience
We have tried to make the workflow and end-user experience of our monitoring system feel like existing enterprise-class monitoring systems such as New Relic. Our monitoring system implementation’s capabilities are very similar to the New Relic system.
A Few Cool Features of Our Monitoring System
Great visualization experience
It gives a perfect visualization of performance graphs at a glance. It is very responsive and simple to understand.
Rich devices support
It can monitor the server, network devices, applications, logs, etc. As discussed above, Telegraf, the data collection agent within the monitoring system, is very versatile and supports many third-party integrations, which makes this system open for nearly all modern-day platforms.
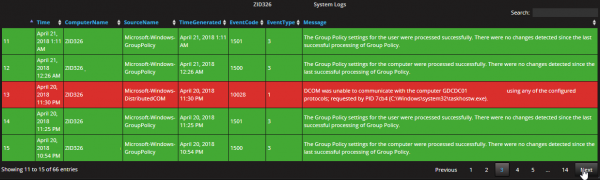
Event log monitoring
Integrated alerting system
The alerting system within our monitoring system is an added advantage that gives us various options for alerts, such as email, Slack, Webhook, etc.
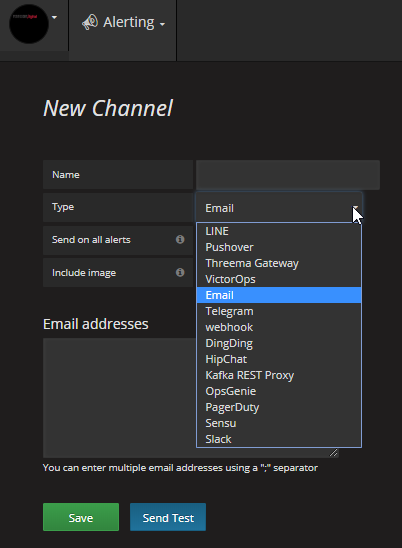
Available alerting channels
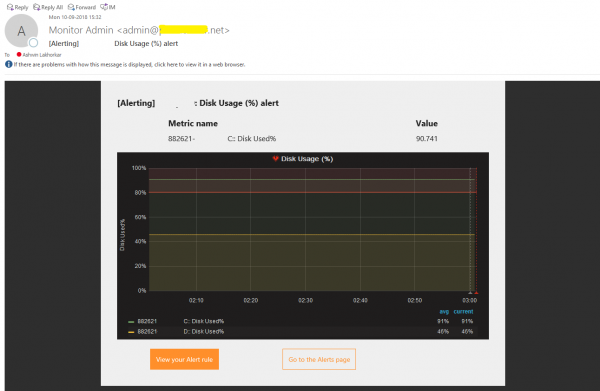
Email alert example
Webhook alerting (Jenkins supported)
We have implemented a Jenkins integration in such a way that whenever a threshold is crossed for a given server, it sends an email alert and triggers a Jenkins job, which executes a PowerShell script on the respective server and collects a detailed performance report of the server.
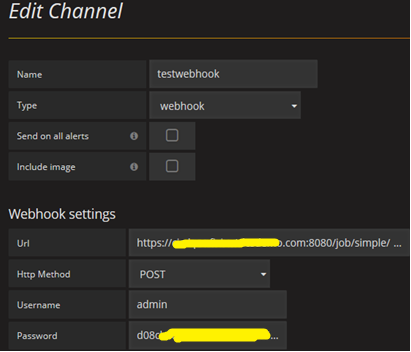
Webhook configuration
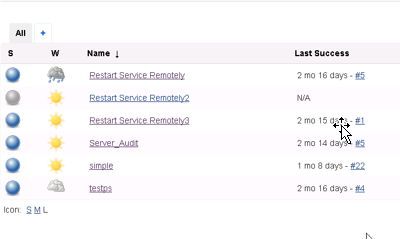
Jenkins job
Custom script support
In our environment, we are monitoring various files and folders. If any activity happens to these files or folders, a PowerShell script logs the appropriate entry to the monitoring system.
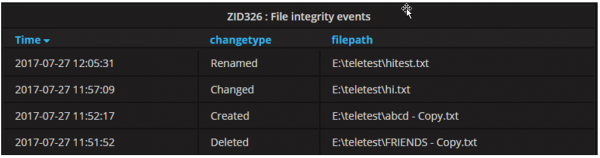
Custom Script results to monitoring system
Better users and groups management
Users can be added via a signup form or email invite. Their level of permission can be configured and they can be added to groups, which can represent project-specific teams.
Optimized and strong ecosystem
Compared to other available open source monitoring systems, our implementation utilizes less computing resources to function. There are various third-party plugins that can be used with it.
Our Monitoring System Implementation: The Way We Monitor
We use this open source, in-house monitoring system mainly for our dev and stage environments as a better alternative to existing monitoring systems in the market, which are costly and not customizable.
Currently, we are monitoring the performance and logs of dozens of servers, a few firewalls, and network devices. Implementation includes servers from different projects, and the server groups are well organized according to their project through the user and group management capabilities of our monitoring system. As of now, our system is configured to keep the past 45 days of monitoring data, which can help us to review recent past incidents.
Final Thoughts
All the above scenarios and implementations are focussed mainly on e-commerce-based web application environments, which represents only a small fraction of the possibilities and features that can be achieved with a monitoring system. Monitoring systems can be utilized for other business needs such as product sales data, services feedback data, employee performance data, and so on. Just like with monitoring systems, automation can also be performed for various requirements. For instance, it can be integrated with JMeter to do live analysis during load testing of your website.
If a system produces information, you can probably collect it using a monitoring system. There still a lot which can be achieved. Monitoring technology is constantly evolving to meet new requirements, and monitoring systems are considered one of the most important parts of the DevOps pipeline, which is the top most discussed and practiced methodology of the current day.