TIBCO BW application performance monitoring is essential to find and correct when an unusual behaviour is occurring and also to know memory and CPU usage of TIBCO BW applications.
We have many tools to monitor the application’s performance and JConsole is one among them. It can be enabled to monitor the TIBCO Business Works engine.
JConsole:
The JConsole is a monitoring tool which comes with a graphical user interface and it complies with JMX specification. It uses JVM [Java Virtual Machine] to provide details about the memory/CPU usage, performance of applications is running on a machine either local or remote.
The JConsole executable file is located in the jdk_home/bin. This can be executed through the command prompt as well.

Steps to enable monitoring:
- Create a simple BW application based on either HTTP or JMS transport.
- Build an archive and deploy it in TIBCO Administrator.
- Open .tra file of your application. For example – sample_application.tra which is located in Tibco_Home\tra\domain\domain-name\application\application-name.
- Add following lines to .tra file to enable JMX monitoring of your application.
Jmx.Enabled=true
java.property.com.sun.management.jmxremote=true
java.property.com.sun.management.jmxremote.port=8887
java.property.com.sun.management.jmxremote.authenticate=false
java.property.com.sun.management.jmxremote.ssl=false
- Restart the application from TIBCO administrator.
- Open JConsole application, which is located in jdk_home/bin.
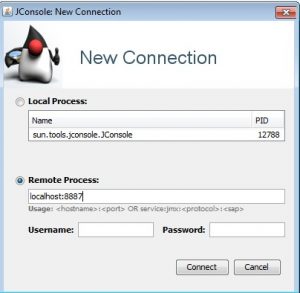
- Select either Local Process / Remote Process where the application is running.
- Once Remote Process option is selected, provide the hostname and port which is configured/added the in previous step.
Example: localhost:8887, no need to provide a username and password as we set authenticate=false in the .tra file.
- Click on the Connect button to connect it.
- Once the JConsole is connected, Memory usage, CPU usage graphs with a few more details like threads and classes can be seen.
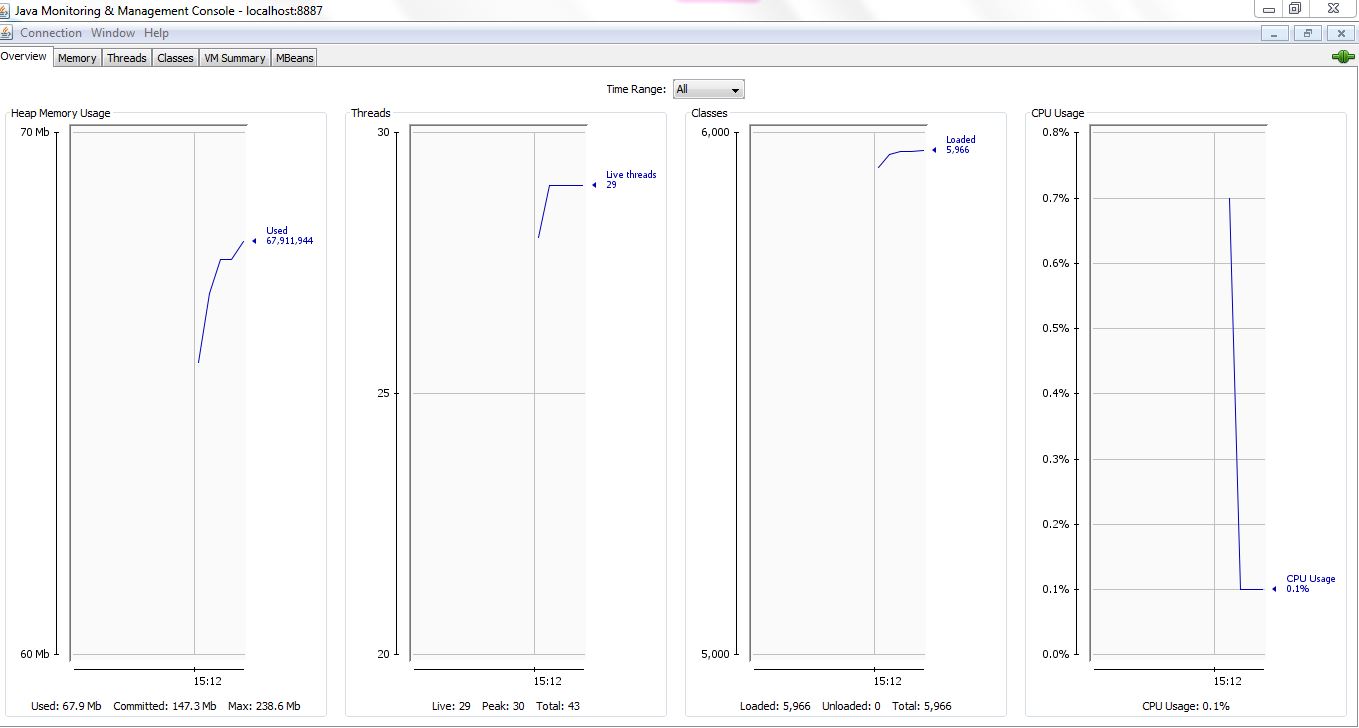
- Now start sending more requests to the process and see the performance of it. If needed the timeline can also be changed to see the performance of an application.

Conclusion:
This blog described the steps for configuring Jconsole to monitor TIBCO Businessworks applications performance.