In my previous posts, we saw how to create a table report and a pie chart. Today, I am adding another dimension to our tabular matrix by giving the users an option to expand or collapse a report. Such reports are called drill down reports in SSRS.
If you haven’t yet checked out my post on creating a simple table report, you can do so by visiting – https://blogs.perficient.com/dataanalytics/2013/10/25/creating-first-ssrs-report-part-2/
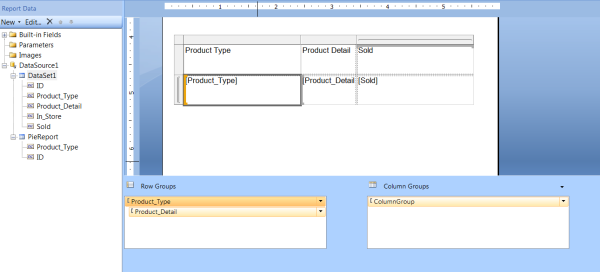
I am going to create a quick and simple matrix report with Product_type as the parent group and Product_detail as the child group.
Step 1: For illustration purposes, I am assuming that we want to see or hide Product_detail field. Right click on Product_detail field and choose Group Properties.
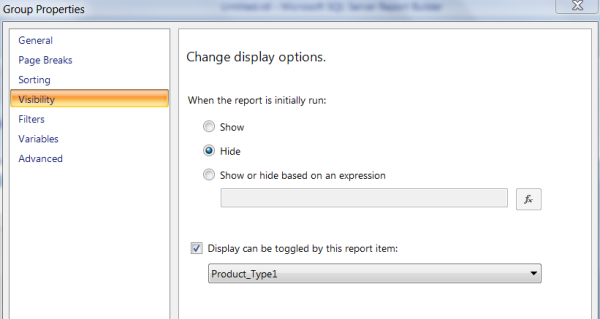
Step 2: Choose Visibility tab and select Hide.
(In this step, we chose “Hide” because we want the report to open collapsed)
Step 3: Select “ Toggle can be displayed by this report item:” and choose “Product_Type1” from the dropdown.
This step means “Product_details” field will be visible based on whether we expand/collapse “Product_type1” field.
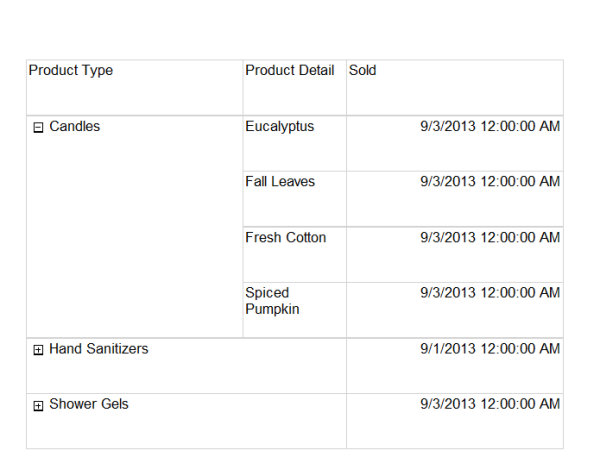
Run the report and click on + sign to expand and – sign to collapse the report. I hope you enjoy this post. Stay tuned for more 🙂


