Topic: Create Trending Reports with Analytic Snapshots
A common misconception with Salesforce reporting is that you can’t produce trending reports based on Salesforce data. For example, let’s say you want to evaluate Agent Performance over time by taking a look into your historical Case data?
Are my agents closing cases faster over time?
What elements would be necessary to generate such a report? Ultimately, you need the ability to “freeze” the data on a regular interval. If you want week over week performance metrics, on a weekly basis you would need to calculate the average time to close for an Agent’s set of cases that were closed in the last 7 days and save that avg. time to close number, the Agent’s name, and the date the record was frozen.
The raw ‘trending’ data would look something like this:

And the report that you can generate using that data would look something like this:

And the chart that you can overlay on top of that data would look something like this:

You might be thinking that I am crazy to suggest that you manually export and import historical records on a weekly basis using the Data Loader or another type of tool. Luckily, I don’t have to suggest that approach because Salesforce has provided a tool that can be used to freeze the data for you … (drumroll) … it’s the Analytic Snapshot! Once setup and scheduled, your data can be frozen into a custom object whose sole purpose is to store the trending data. The overall setup of Analytic Snapshots involves 4 basic steps:

Step 1: Setup a Report to show the data to capture:
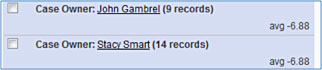
The Agent Performance report needs to show:
a) The Agent’s name = Group the report by “Case Owner”
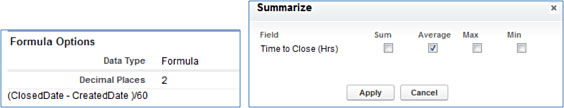
b) Average Time to Close a Case = Apply the Average function on Case custom field, “Time to Close (hrs)”. The custom field subtracts the Opened Date (a.k.a. CreatedDate) from the Closed Date and divides the result by 60.
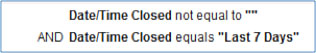
The filter should look for Closed Cases with a Close Date in the Last 7 Days:
Step 2: Setup a Custom Object to store the report’s data:
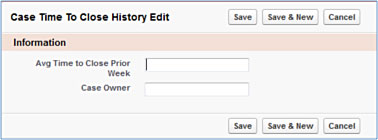
The fields on the custom object should align with the fields from the report created in step 1.
Step 3: Configure the Analytic Snapshot by mapping your object’s fields to the report’s fields, and setting the schedule:


Step 4: Configure a Report and Dashboard Component to display your trending data

It’s as simple as that! No code, data migration or integration required. Happy data analysis!