One of the tools that we have been evaluating during our Analytics Study is IndexTools. IndexTools is a powerful web analytics tool that is available at a relatively low price. I sat down with Dennis R. Mortensen, IndexTools COO, and we went through 10 cool things you can do with IndexTools. Here they are:
1. Customize Reports: One of the cool things about IndexTools is the simplicity with which you can customize reports. Using the drag and drop interface, you can quickly and rapidly build up customized reports that can give you uncommon insight into your data:
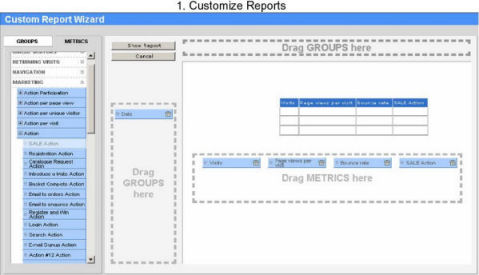 |
Without this capability, you would need to drill down into your data many times, export the data, and use a spreadsheet to do the type of cross referencing of data that this tool will let you do on the fly.
For example, if you look at the day by day visit numbers for the month of May 2007, you have a dumb report that provides no insight at all. If you wanted to understand where a spike in traffic had come from, you would simply see what day it was, and not the insight that you are probably looking for. Let’s imagine that you operate an eCommerce business, and you wanted to see if the spike came from search engine traffic in a particular city. You can get that data in 3 easy steps in IndexTools. Here is the type of data you can get for your trouble:
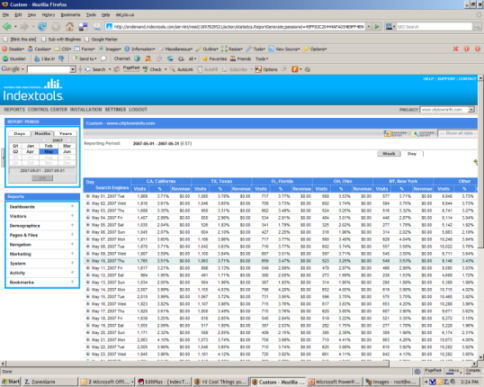 |
OK, so it’s a little hard to see for resolution reasons, but the data we requested is broken into several columns, neatly segregated by cities. Want to change the cities to states, takes just a few seconds to do. The process allows you to rapidly tune the data analysis to your needs.
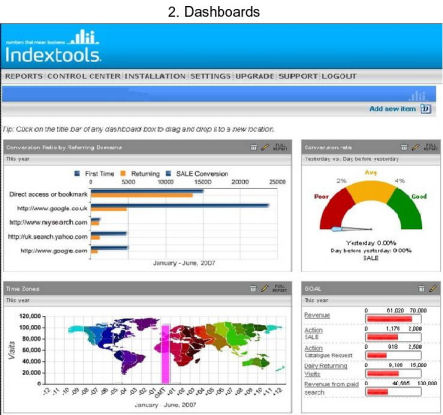
2. Customize Dashboards: Dashboards in general are cool. The IndexTools philosophy is that you should be able to set up your dashboard to show you only your Key Performance Indicators (KPIs). Better still, what IndexTools allows you to do is to set up separate dashboards for each user. For example, you may have a country manager who is compensated based on the performance of the business in his/her country.
You can set up a dashboard for that country manager so that they can log in, see the data they need that relates to their personal KPIs, not have to do any surfing around, and they are done. Interestingly enough, you can also prevent the user from having any configuration or customization capabilities. So your high-level business users, people who are not analysts, don’t have to worry about accidentally messing up the configuration for other people.
Here is a sample dashboard screen:
 |
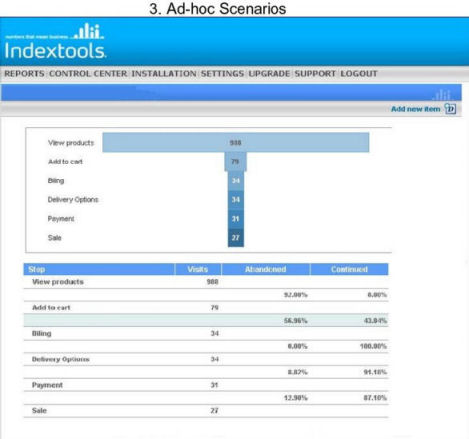
3. Ad Hoc Scenarios: IndexTools is one of the few packages we looked at that supports Ad Hoc analysis (that being the ability to drill down and do segmentation and/or filtering of historical data). For example, imagine that you run an eCommerce business that sells sports apparel. You plan to run a special on sneakers this Christmas, but you want to get the timing right. So you want to look at last years data, and see what parts of the sales funnel had the biggest problem specific to sports sneaker sales.
All you need to do is set up your filters, custom reports, or segments, and set the time period to the one you want. Right then and there you have the data you are looking for. Here is an example Ad Hoc scenario screenshot.
 |
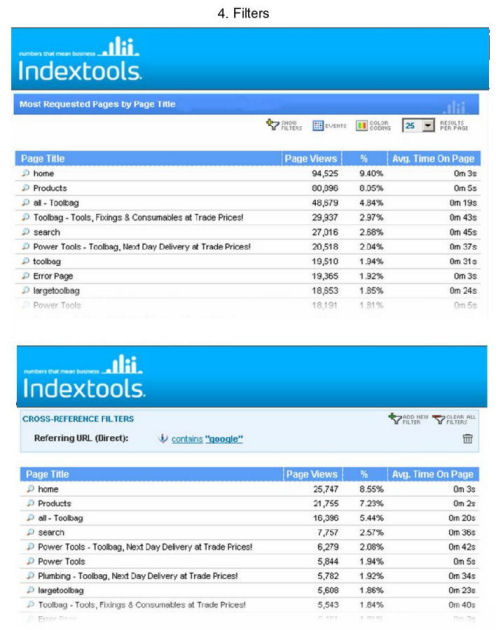
4. Filters: Filtering in IndexTools is cool because in more standard reports you can apply filters right there from the same screen. There is no special place you have to go to set them up. And you can add more than one filter, and create compound filters quite easily. To start, select the “Show Filters” icon on the screen (as shown in the screenshot below). Once there you can pick from a wide selection of Demographics, Campaign, Entry Page, Content Group, Referrer, or System filters.
And one this is done, you can bookmark your report and save it for later. So each time you enter IndexTools you can easily get access to the custom report, including filters you have set up to get the data you need quickly. Here is an example of a report with more than one filter:
 |
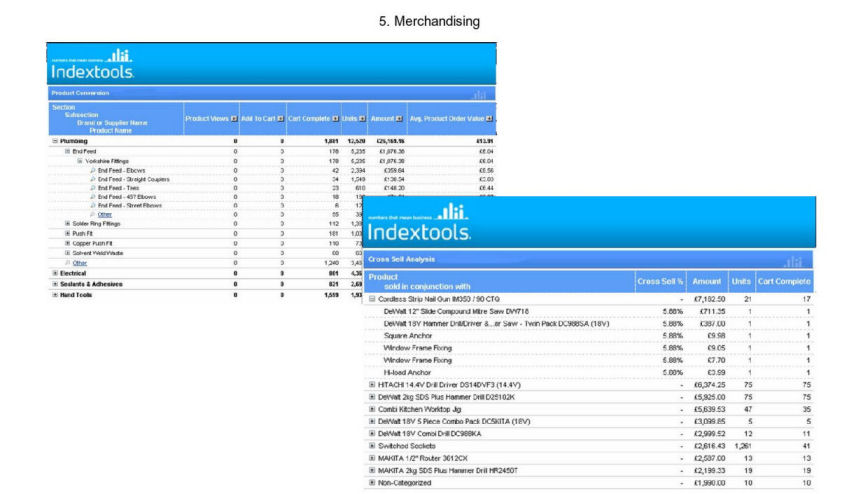
5. Merchandising: All the tools we reviewed included merchandising capability. With IndexTools, you can upload a spreadsheet containing all your custom category information. So for example, you might upload a spreadsheet that has Brand Groups, then Sub Types, then Brands, and then Product Name. But what happens if you want to sort on the Brand Name at the top level instead? Or any other reconfiguration of the hierarchy?
Easy. Just click on Customize Reports, and then drag and drop the categories into the orders you want. Then click on Show Report. IndexTools adapts the report and presents the data to you on the fly. Here is a screenshot showing the before and after picture for this type of scenario:
 |
6. Path Explorer: Visual overlays are easy. All the packages we reviewed offered some form of a visual overlay (a visual overlay is a screen that shows you a given page, and the click-through percentage for all the URLs linked to from that screen). Some things that are a bit harder are dealing with https v.s. HTTP, cross domains, Ajax, Flash, Videos with interactive elements, Dynamic menus, DHTML, etc., and many packages deal with these types of things as well.
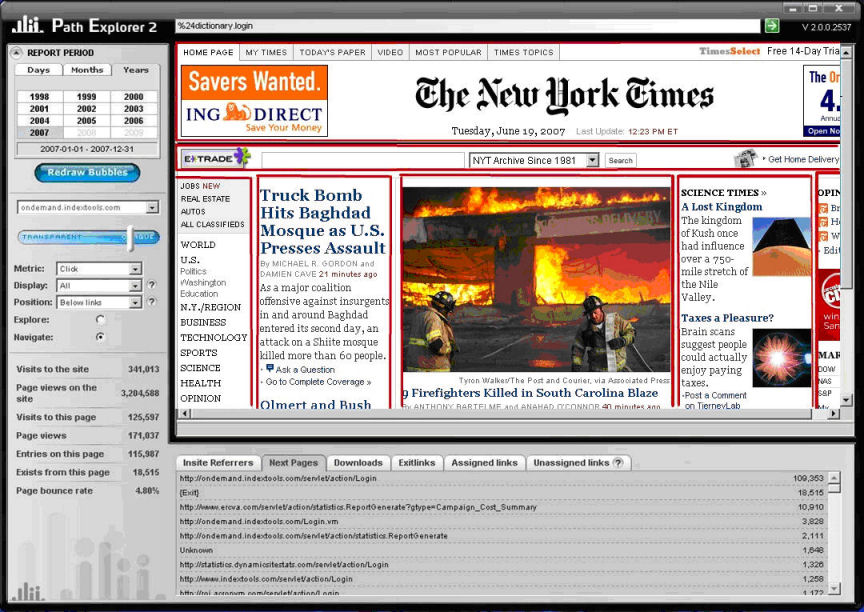
In the IndexTools Visual Overlay, there is another cool feature. You can take the visual overlay screen and define specific content areas, and see how a specific content area performs just within that area. This capability allows you to see how specific content performs, or how a specific location on the screen performs (independent of the content).
This could be a critical data in a newspaper business, for example, where the news story in a list of stories may change every hour, or even more frequently. Understanding the performance of a position on the screen is critical. For example, if position 1 normally has a click-through rate of 7%, and the current story is getting a click-through rate of only 4%, it may be time to push it down in the list, and move some other story into the #1 slot. Here is a screenshot of this in action:
 |
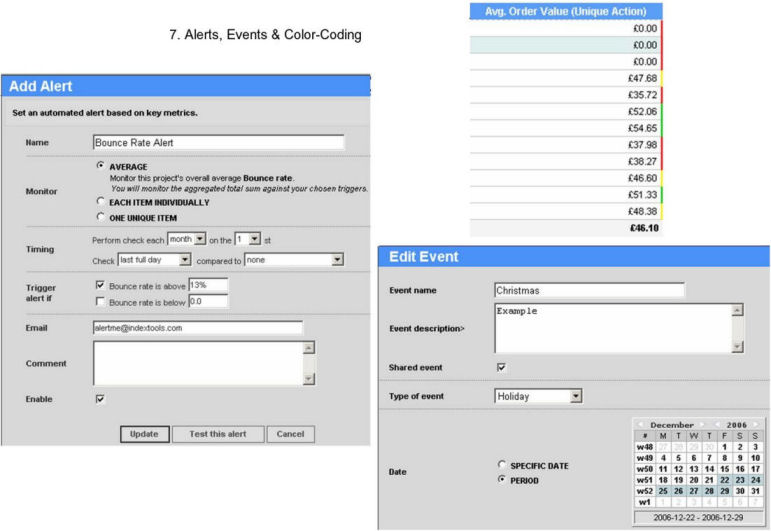
- Alerts, Events, and Color Coding: IndexTools allows you to set alerts, events, and to color code items related to those events. For example, let’s say a salesperson promised you X impressions, Y clicks, and Z leads when you sign up for an advertising campaign. You may never remember that promise later. But you can set up an alert to tell you at the end of the campaign how you did, and how it compared to expectations. This makes it easy to set up the monitoring of a campaign on the front-end when your memory of the goals are fresh. The color coding allows you to use red for underperformance, and green for meeting or exceeding goals.
You can also use these capabilities to tell you when you get traffic spikes. This is really useful if you are engaging in social media campaigns, or you just want to know when your traffic takes a leap forward due to a repositioning of your site in the search engines. Very useful! Here is a sample screenshot:
 |
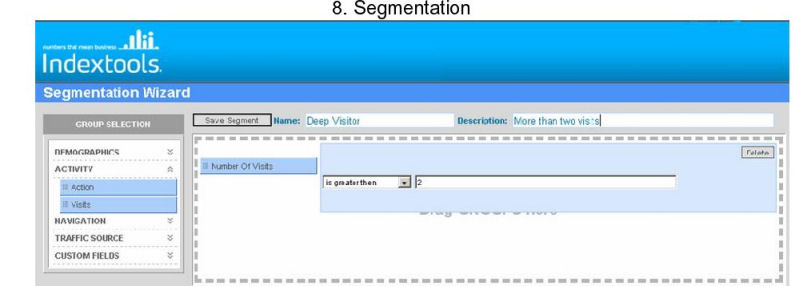
8. Segmentation: Segmenting users on your site is a basic capability for an analytics package. There are so many ways to use this type of capability. For example, perhaps you want to look at the behavior of registered users in one segment, past customers in one segment (if this is different), and everyone else in another segment. For that matter, segmenting users by geography, or referrer is also very interesting to do.
One of the cool things that IndexTools allows you to do is to implement multiple segments at once. For example, what if you wanted to look at the behavior of registered users who are from Germany? In addition, you can set up multiple segments that are unrelated, but they are important to you, for example, if you wanted to be able to look at all this quarter’s business objectives in a simple manner. To do it, all you need to do is use the Segmentation Selector. This screen uses a drag and drop interface similar to the Customize Reports screen, as follows:
 |
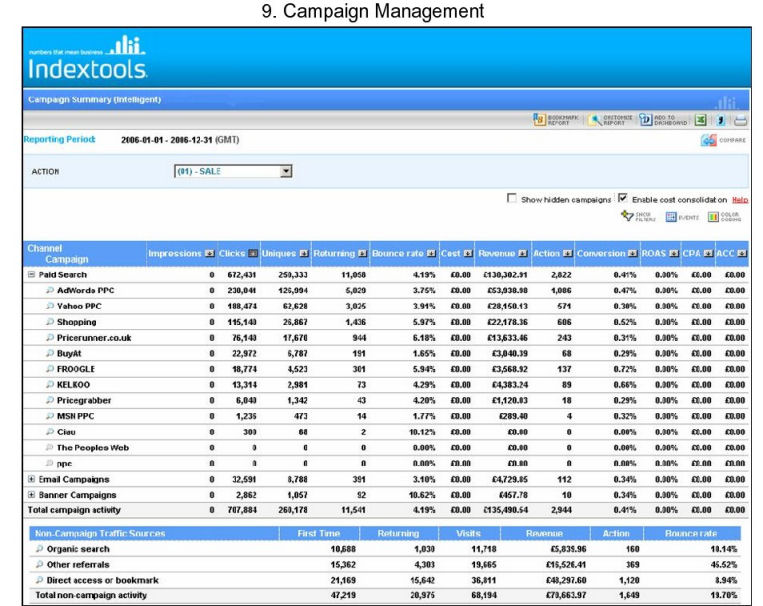
9. Campaign Management: Sometimes when you look at the industry, it seems like people don’t think about organic traffic as something that needs to be measured on an ROI level. But, of course, it is equally important to measure your ROI on an organic campaign as with a PPC campaign. One of the things that is cool about IndexTools is that the Campaign Management screen shows all your PPC campaigns and the results from your organic campaign.
This puts all the campaign information you need where you want it, on one single screen such as this one:
 |
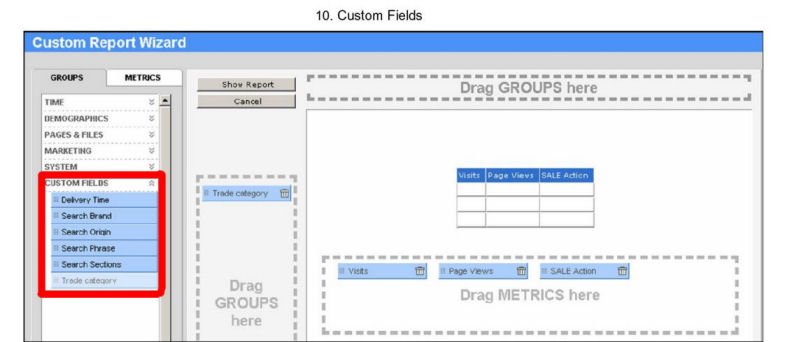
10. Custom Fields: Last, but certainly not least, IndexTools offers you a custom field definition capability. Using the travel business as one simple example, you can define fields for coach seats, business class seats, and first class seats. You can then monitor how the behavior or people who buy these types of seats differ. Or, you can see what search terms drove sales of what types of seats.
Want to monitor your internal search engine? You can set this up to monitor click-through rate by keyword, or by search position. You can see what search terms lead to people becoming buyers. This is interesting for eCommerce sites because for some of these sites 50% of sales are driven through internal search.
But you can go even further. If you are offering videos on your site, you can see what percentage of users watched all of it, half of it, or how many went on to watch a second video. Currently, setting these up needs to be done by the IndexTools professional services team, but once it’s done, the custom fields are available to you in your Customize Reports screens as shown here:
 |
Summary
IndexTools is rich in features and flexibility and offers a lot for many businesses. The above list of 10 things should give you an introduction to some of the cools things you can do with this package. But here is the 11th one for you. IndexTools also offers real-time tracking (with only a 3-second delay). While this may not matter to many businesses, there are some sites where it’s critical.
For example, if a newspaper site used Path Explorer to determine that a story in position 1 is underperforming, they would want to move it off. Of course, making this type of decision would need to be done in real time. And this is something that IndexTools offers you as well.
