The Panda algorithm hit the SEO world in a big way back on February 23rd /24th. Here is the general update history of Panda:
- Panda 1.0: February 23/24, 2011 – The initial launch.
- Panda 2.0: April 11, 2011 – added Chrome Blocklist Extension data to impact eHow, plus global English coverage.
- Panda 2.1: May 10, 2011 – general algorithm tweaks.
- Panda 2.2: June 16, 2011 – improved scraper site detection, probably to reduce the incidence of scraper sites outranking source sites that got hit by Panda.
- Panda 2.3: July 23, 2011 – some sites recover due to algorithm changes in Panda.
- Panda 2.4: August 12, 2011 – Panda rolled out internationally.
- Panda 2.5: September 28, 2011 – Appears to have affected many sites, including sites with lower levels of traffic.
- Panda 2.5.1: October 9, 2011 – minor update.
- Panda 2.5.2: October 13, 2001 – minor update.
- Panda 3.0: October 19/20, 2011 – a major update that let many sites recover. Evidently, this was intended to help those who had been unfairly hit by Panda back in the game.
- Panda 3.1: minor update.
Today I will present a visualization of the basic structure of how this works. I am basing this on the many hours of reading I have done on the topic, Google’s statements that Panda is a document classifier, and the indications by Matt Cutts that it is a process that is run periodically.
First though, a disclaimer. I am not a machine learning expert, and this should be used as a basic conceptualization of the workflow. Major elements are likely to differ from what you see here. However, I believe that this visualization is accurate enough to help you develop a solid mental model for how the algorithm is being applied.
Possible Panda Workflow
As a first step, Google is likely to have defined an initial test set of sites. These sites would then have been classified manually by human raters. The process would look something like this:
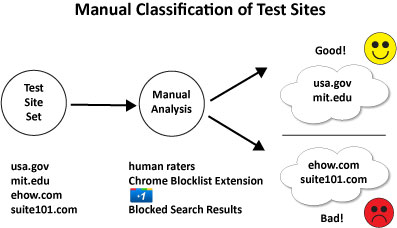 |
This would allow Google to have a strong test database of manually rated sites, which therefore is accurate with a very high degree of probability, perhaps with a 99% degree of accuracy. As you can see sites would have been separated into buckets, such as “Good Sites” and “Bad Sites”.
As a next step, Google may have then spent time analyzing these sites to profile the characteristics of the Good Sites, and also of the Bad Sites, as follows:
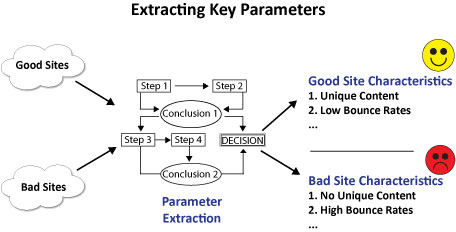 |
The idea is to develop a model for both types of sites. Of course, you can also have a continuous scale of Goodness, from Bad, Not so Bad, OK, Pretty Good, Very Good, and so forth. Once you have a model for Goodness vs. Badness, you can then step back and analyze what types of parameters you can evaluate algorithimically to get the same results as your human raters did during their evalation.
One key factor in this is the noisiness of the signal. In other words, is there enough data available on all the sites you want to test for the data to be statistically significant? In addition, is it possible that the signal can be ambiguous? For example, does a high bounce rate always mean it is a bad site? Or are there scenarios where a high bounce rate is an indicator of quality? Consider a reference site where a faster bounce might mean that the person got their answer faster.
There are lots of signals you could consider. Here are just a few examples:
| User Behavior | Content Attributes | Searcher Ratings |
|---|---|---|
| Brand Searches | Reading Level | Chrome Blocklist Extension |
| Site Preview | Editing Level | +1 |
| Ad CTR | Misspellings/Grammar | Blocked Search results |
| Bounce Rate | Something new to say | |
| Time on Site | Large Globs of Text | |
| Page Views Per Visitor | High Ad Density | |
| Return Visitor Rate | Keyword Stuffing | |
| Scroll Bar Usage | Lack of Synonyms | |
| Pages Printed |
Of course, the correlations between good sites and bad sites may use even more obscure signals. A machine learning algorithm may determine that articles that use the word “oxymoron” more than 5 times are inherently poor quality (note to algorithm, this article uses oxymoron only once … oops twice). I personally think that Google would try to constrain the breadth of signals used, but it is certainly possible that the algorithm came up with some unusual correlations.
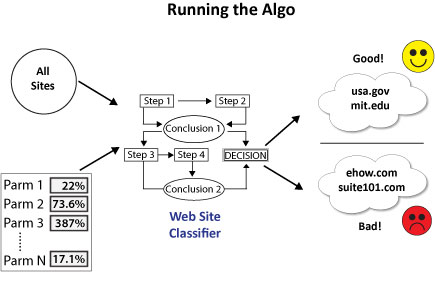
Once the signals have been decided upon, the algorithm can then set out to test the performance of those parameters with a variety of weights, and can also vary the signals used:
 |
That is the first step. But how did the algorithm do? The next step is to score the results:
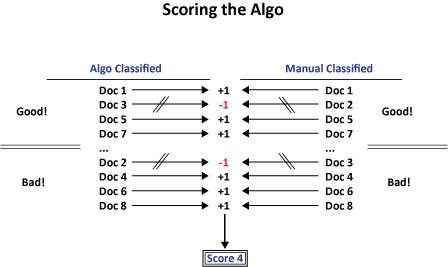 |
Once you have your score, the algo can try to figure out what tweaks to make to the parameters used and the weighting of each one to create a better match between the manual classification they did of sites and the algorithmic output. You can also test the results on a larger data set using your validating signals. This allows you to look beyond the limited test set you worked on manually. Together, these comparisons lead to a feedback loop:
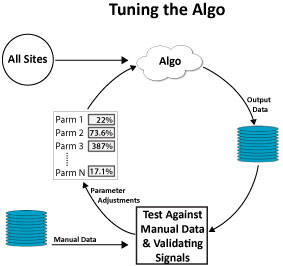 |
To finish the process, the machine learning engine would simply repeat the tuning loop until the results were of acceptable quality.
Summary
As mentioned above, this is just my mental model for what took place, and it is likely that the exact course of events was somewhat different.
Ultimately, the key lesson is that publishers need to focus the great majority of their efforts on building sites which offer deep, unique, rich user experiences. The search engines want to offer these types of experiences to their users, and Google and Bing are battling for market share. Focus on giving them what they want in the long run because this battle for market share will surely make roadkill of those that don’t.
The algorithm will certainly be tuned more and more over time, so don’t get too wrapped up in trying to find out the specific factors in use by Google. Even if you succeed in finding it and artificially manipulate your site to score well on those factors, the next set of factors that will get applied may be entirely different. It is simpler to just focus on producing high quality content that is not only non-duplicate, but also differentiated, and then promoting that effectively through a variety of channels.
