This week, Perficient is exhibiting and presenting at Kscope14 in Seattle, WA. On Monday, June 23, my colleague Patrick Abram gave a great presentation on empowering restaurant operations through analytics. An overview of Patrick’s presentation and Perficient’s retail-focused solutions can be found in Patrick’s blog post.
Today, Wednesday, June 25, I gave my presentation on Reverse Star Schemas, a logical implementation technique that addresses increasingly complex business questions. Here is the abstract for my presentation:
It has long been accepted that classically designed dimensional models provide the foundations for effective Business Intelligence applications. But what about those cases in which the facts and their related dimensions are not, in fact, the answers? Introducing the Reverse Star Schema, a critical pillar of business driven Business Intelligence applications. This session will run through the what’s, why’s, and when’s of Reverse Star Schemas, highlight real-world case studies at one of the nation’s top-tier health systems, demonstrate OBIEE implementation techniques, and prepare you for architecting the complex and sophisticated Business Intelligence applications of the future.
When implemented logically in OBIEE, the Reverse Star Schema empowers BI Architects and Developers to quickly deploy analytic environments and applications that address the complex questions of the mature business user.
So, just what is a Reverse Star Schema? The Reverse Star Schema reverses the relationships one would see in a classic Star Schema, with the dimensions, rather than the facts, being the primary interest. Think, “show me sales dates by representative” rather than “show me sales volumes by date and representative.” In the first scenario, the fact (sales volumes) isn’t of interest to the user; it need not enter the equation other than to create the intersection between representative and date.
Use cases for Reverse Star Schemas range a broad spectrum. Sometimes, the return of the intersection of dimensional data is truly all the user needs; more often, however, the Reverse Star Schema is the avenue to establish cause-and-effect relationships amongst indirectly related data concepts. Let’s take the following simplified business question: “show me Z, filtered by B & C and aggregated by Y.”
In this scenario:
- B & C are not dimensions of Z
- B & C are not subsets of Y
- B & C are not directly related to the Fact (Z) they are required to affect
Rather, B & C’s relationship to Z is established through fact A and conformed dimension N.
With respect to the question asked by the user, the values of A & N aren’t of interest. Instead, A & N are simply avenues through which the needed attributes are accessed.
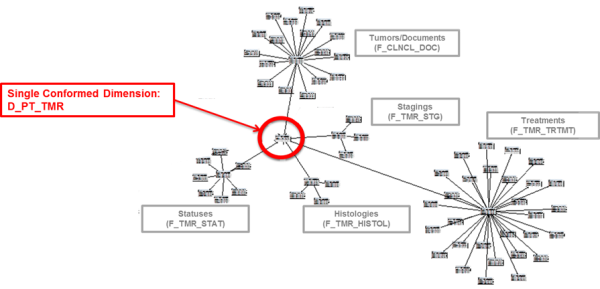
To provide some real world context, a client presented complex requirements that emerged as the perfect candidate for a Reverse Star Schema implementation. One of the nation’s top cancer care centers was seeking an on-demand means to identify patient cohorts, or groups of like-attributed patients. Physicians should be able to refine cohorts by basic tumor information and various disconnected factors of cancer care, and a filter applied to one factor should trickle down and affect the results of all other factors. Physically, our data model emerged as a classic Star Schema with five unique facts sharing only one conformed dimension.
Logically, it quickly became apparent that the classic Star Schema just wouldn’t fulfill our main requirement—a filter applied to any of the factors should affect the results of all other factors, even though the factors are independent of each other. In the classic Star Schema design, each fact and its dimensions are independent of the other facts. Filters applied to the dimensions of one fact do not affect the results returned in another fact.
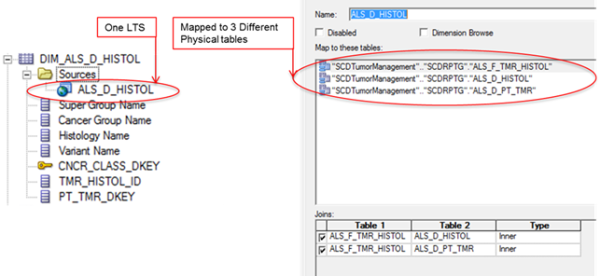
To address this requirement, we logically implemented a Reverse Star Schema in the OBIEE RPD Business Model and Mapping layer. Individual dimension tables were brought from the Physical Layer into the BMM Layer, and then each table’s Logical Table Source was edited to map it through its join path to the single conformed dimension.
This allowed each dimension, no matter its original conceptual area, to be logically joined directly to all the other facts in the Subject Area, while maintaining the physical integrity of the data model.
To address data integrity issues, we leveraged OBIEE’s aggregation concept of “Based on Dimensions.” Depending upon the use case, OBIEE’s “Level Based Measures” concept could also be applied to resolve data integrity issues.
By leveraging the Reverse Star Schema concept, the BI application empowered Physicians to quickly identify patient groups, analyze all of the factors of their cancer care vs. their outcomes, and make informed refinements in treatment plans for other like-attributed patients going forward.
Further details on this implementation technique can be found within the complete Kscope14 presentation.


Nice post on reverse star schema. Analytics has evolved to point of asking non-traditional questions which is not mainstream EDW. Models and techniques has also evolved to meet those needs. The challenge though is to get to the confirmed dimension – thanks to MDM and DG that is becoming a possibility as well.