
Website performance is crucial for user satisfaction and overall business success. Slow-loading pages, unresponsive features, and delayed database queries can lead to frustrated users, decreased conversions, and a poor user experience. One key to improving site performance is identifying bottlenecks in your database interactions, and that’s where SQL Server Profiler comes in.
SQL Server Profiler is a tool provided by Microsoft SQL Server to help database administrators, developers, and support teams monitor, trace, and troubleshoot SQL Server activity in real-time. It captures and analyzes SQL Server events such as queries, stored procedures, locks, and performance issues.
How SQL Server Profiler Helps Improve Website Performance
- Identify Slow Queries: One of the most common causes of slow website performance is inefficient database queries. SQL Server Profiler allows you to capture query execution times and identify which queries take too long to execute. Once identified, these queries can be optimized through various methods such as indexing, query refactoring, or adjusting database schema.
- Monitor Server Load: SQL Server Profiler can show how your server responds under load, such as which operations consume the most CPU and memory resources. You can monitor the server’s performance over time to ensure it’s scaling appropriately or identify when you need to upgrade your hardware or optimize your server configuration.
- Track Deadlocks and Blocking: Deadlocks and blocking can significantly affect your site’s performance by causing delays in query execution. SQL Server Profiler helps you identify deadlock situations where two or more queries are waiting for each other to release resources and blocked queries waiting on locks. You can optimize your database’s locking strategy to reduce contention and improve performance by tracking these.
- Optimize Indexing: Poor indexing is another common culprit behind slow database performance. SQL Server Profiler captures queries that could benefit from better indexing. With this information, you can identify which columns are frequently accessed and may need new or optimized indexes to speed up query execution.
- Analyze Execution Plans: SQL Server Profiler can capture and analyze the execution plans used by SQL Server for queries. Reviewing these plans lets you identify inefficient operations like full table scans, missing indexes, and redundant joins. Analyzing and improving execution plans is critical in optimizing SQL Server performance.
- Tuning SQL Server Configuration: SQL Server Profiler helps you identify issues in SQL Server configuration that may affect your site’s performance. For example, you might locate memory-related issues, insufficient buffer sizes, or improper settings causing slowdowns. These can be fixed through configuration changes to improve performance.
How to Create a SQL Trace in SQL Server Management Studio
You need to capture the events that will help you identify slow queries and stored procedures. In this blog, we will discuss one of the events provided by SQL Server Profiler.
RPC: Completed – This event will capture the execution details of stored procedures that are called remotely.
- In SQL Server Management Studio, open the Tools menu, then select SQL Server Profiler.

- Profiler will then ask you to log into the SQL Server instance you want to run the trace on. After logging in, a new Trace Properties window will automatically open. Here, you must provide a name for the new trace and select a trace template.

- Next, click on the Events Selection tab. This tab allows you to select what SQL Server events you want the trace to capture and apply filters to block out the events you do not want to capture. The default trace captures events for all instances’ databases and user accounts. Check the Show All Events and Show All Columns check box at the bottom right to view all events and the respective columns.

Columns to Include:
Ensure the following columns are selected to track performance and identify slow Stored Procedures:
-
- Duration – Time taken to execute the query or stored procedure.
- TextData – The SQL query or stored procedure that was executed.
- ApplicationName – To identify which application made the request.
- LoginName – The user who executed the query.
- CPU – The CPU time used for the query.
- Reads – The number of logical reads (I/O) for the query.
- Writes – The number of writes during query execution.
- If you want to see all the events for a specific database, apply a filter by database names that are “like” or “not like.”

Running a Trace

Running trace-capturing events for the database. We can stop and start the trace and clear all the events in the trace using the toolbar. If you want to start a whole new trace, you can also do this using the toolbar.
Start a new trace, then load the webpage from which you want to capture data. Once the page has finished loading, stop the trace and review all the events captured.
After stopping the trace, you can analyze the captured data:
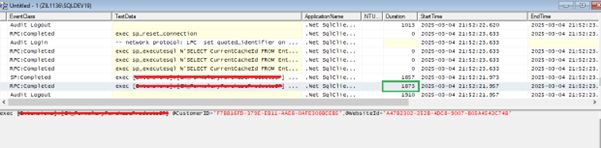
- Sort the data by Duration to identify which stored procedures took the longest to execute (Refer to the image below for the duration it takes for the stored procedure to execute).
- Look for patterns, such as repeated calls to a specific stored procedure or unusually long execution times.
Conclusion
SQL Server Profiler is an invaluable tool for boosting your website’s performance. By identifying slow queries, analyzing execution plans, and tracking server activity, you can pinpoint and resolve performance bottlenecks in your database interactions. Whether you’re dealing with slow queries, deadlocks, or server configuration issues, SQL Server Profiler provides the insights you need to make informed decisions and optimize your website’s performance.
Reference
Thank you for sharing good information.