In the world of robotic process automation (RPA), Blue Prism stands out as a leading platform that empowers organizations to automate their business processes. While designing and developing automated solutions using Blue Prism is essential, debugging plays a crucial role in ensuring smooth operation and efficient execution. This blog will explore some invaluable debugging techniques in Blue Prism that can help you identify and resolve issues, ultimately optimizing your automation workflows.
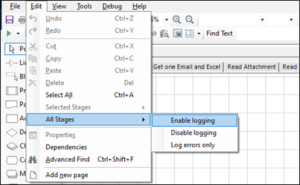
1. Enable Logging
Blue Prism provides comprehensive logging capabilities to track the execution of processes and identify potential errors. By enabling logging, you gain valuable insights into the system’s behavior, allowing you to trace the flow of execution and pinpoint the exact location of issues. Depending on the granularity required, you can enable logging at various levels, such as object, process, or business object. Analyzing logs can provide crucial information for troubleshooting and improving your automation solutions.
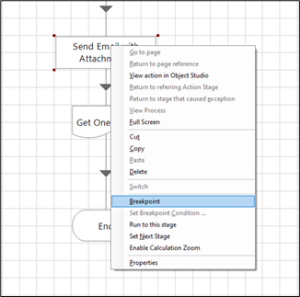
2. Use Breakpoints
Break allows you to pause the debugging process at any given moment. Once this happens, you can choose to Step, Step Into, Step Over, or Stop the debugging process.
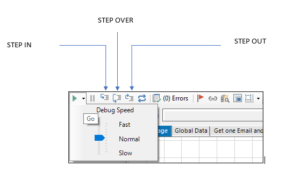
3. Step
This is used to step inside any particular stage at a time, so if you have a page stage, an action stage, or a process stage and if you press ‘Step’ then the flow would go inside the reference workflow. For example, if you are calling an action from a Process Studio and press step, the control would simply go to that action in the Object Studio. (Shortcut F11)
4. Step Over
This is used to step over any particular stage at a time, so if you have a page stage, an action stage, or a process stage and if you press ‘Step Over’, the flow will proceed to the next stage on that page, executing all the workflows that the stage is referencing in the reference workflow, but not allowing you to enter it. For example, if you are calling an action from a Process Studio and you press step over, then the control would simply go to the next action on that page of the Process Studio while all the workflow inside the action will be executed at the backend without you ever going inside the Object Studio. (Shortcut F10)
5. Step Out
This is used to step out of the currently visible page executing all the particular stages called within the workflow at that point of time, so if you have a page stage, an action stage, or a process stage and if you press ‘Step Out’ then the entire workflow in that page is executed taking the control back to the parent page, process or action from where it is called.
For example, if you are calling an action from a Process Studio and press step out, the entire workflow on that page would be executed, including the action and whatever stage you have called after it in the specific workflow. In case you press step out from a Main Page, then the workflow would simply be completed as there is no parent page in this case, but if you press step out inside a subpage, action, or sub-process, then the workflow would be executed, and the control would be back to the parent page or process. (Shortcut Shift+F11)
6. Exception Handling
Exception handling plays a vital role in robust automation design. Blue Prism provides exceptional handling capabilities to gracefully handle errors and exceptions during process execution. By implementing proper exception-handling techniques, you can catch and log errors, perform specific actions or retries, and gracefully recover from failures. Effective exception handling minimizes the impact of errors on the overall automation solution and enhances its reliability.
7. Utilize the Blue Prism Developer Tools
Blue Prism offers a set of developer tools that can greatly assist in debugging and troubleshooting. The Application Modeler allows you to inspect and interact with target applications, verifying selectors and ensuring the correct identification of elements. The Object Viewer provides a detailed view of the application’s hierarchy and properties, aiding in object configuration and validation. Leveraging these developer tools can help identify object recognition and interaction issues.
8. Collaboration and Documentation
Debugging complex automation solutions often requires collaboration with other team members, such as business analysts or subject matter experts. Maintaining clear and concise documentation regarding the automation process, including inputs, expected outputs, and known issues, fosters effective communication and problem-solving. Collaborative efforts ensure a holistic approach to debugging, harnessing collective expertise, and reducing the time taken to identify and resolve issues.
These debugging techniques are used in various situations depending on circumstances so that you can quickly debug a very complex workflow no matter how long it is.
Conclusion
Debugging is an integral part of the automation development lifecycle and employing effective debugging techniques is crucial for successful Blue Prism implementations. By enabling logging, using breakpoints, inspecting data and variables, implementing proper exception handling, leveraging developer tools, and fostering collaboration, you can efficiently troubleshoot and resolve issues within your Blue Prism automation. With these techniques at your disposal, you’ll be well-equipped to tackle challenges and ensure the smooth functioning of your automation solutions.


Amazing Blog Arpit.
Amazing analysis on debugging.