
In the first part of this article, we reviewed the concept of Total Cost of Ownership (TOC) and outlined five key variables that determine the TCO for software development projects: Process, Quality, Risk, Productivity and Cost. Each of these variables is critical to keep in mind when selecting a nearshoring or offshoring vendor. In this article, we will review the remaining three variables in depth and provide suggestions and conclusions for maximizing TOC.
Risk
Studies point to an extremely significant risk of failure in software engineering undertakings. The famous Standish Group CHAOS Report, for example, reviews over 8,000 software engineering projects every two years. The 2010 study determined that close to 42% of software engineering projects were considered challenged; 21% were considered failed, and only 37% were determined successful.
Many factors, of course, impact project risk. However, choosing an organization with a strong technical background and –most importantly—a strong software engineering process greatly diminishes the chance of failure for a project. Caper Jones supports this conclusion in the chart below[vii], ascribing a significantly lower level of risk in dealing with a CMMI level 5 engineering company. In fact, the level of risk is 20 times lower than that of dealing with a CMMi 1 corporation, or close to 6 times lower than dealing with a mature CMMi level 3 vendor).
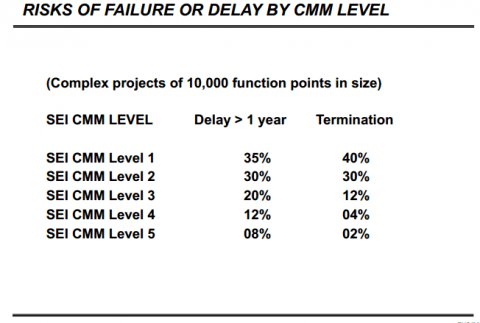
Optimizing the Total Cost of Ownership on an Outsourcing Software Development Project Part 2 photo 1
Perficient Latin America is one of the world’s most experienced companies in deploying software engineering processes at the highest maturity levels. In 2002, we became Latin America’s first CMMi level 5 company (and the eighth in the world to achieve such recognition). Perficient Latin America has remained at the highest level of this quality model since then.
Risk mitigation is the result of correct execution on many fronts; one of the most important ones being early risk identification, so that corrective action may be taken before it is too late. Transparency is critical in order for the risk to be actively perceived, and it is a variable in which Perficient Latin America excels. As a company, our policy is to provide our clients with full and unrestricted, real-time access to all project repositories. Furthermore, we monitor (at least weekly) and maintain a record of key productivity and quality variables during all of our engagements. Consequently, we are ready to take corrective action as soon as a problem arises, preventing risk to carry-forward and momentum gains.
Now, employing a strong and disciplined engineering process alone is not sufficient to mitigate risk; one has to have the right process in place. In this regard, Perficient Latin America chooses SCRUM as its methodology of choice. We are convinced SCRUM provides the agility, flexibility, and team commitment (client and vendor) required to minimize project risk.
Perficient Latin America is an expert in SCRUM, leading Latin America’s implementation of the methodology since 2006. In fact, our company’s SCRUM mentors are chosen from the best of the best, including the renowned Mitch Lacey from the US (SCRUM coach to Microsoft, Yahoo, Motorola).
One variable often not taken into account when calculating project risk under a nearshoring relationship is Churn Rate (or employee rotation per year). Chun rate in the outsourcing industry can reach levels of 20 to 30% per year, requiring expensive team re-education and causing project delays.
PSL’s current churn rate is best-in-class, boasting an average of less than 6% per year for the last three years.
There are many ways to calculate the positive economic impact risk mitigation has on Total Cost of Ownership (or the extremely negative impact of its correlate, risk materialization). Although the economic cost of risk is specific to each project, we believe there is significant value in working with Perficient Latin America: a vendor that, in 30 years, has never had an aborted project or a troubled initiative where the client has resorted to legal action to recoup a lost investment.
This fact, although not initially reflected in the “sticker price” of a rate per hour analysis, undoubtedly diminishes the expected Total Cost of Ownership of a solution or project undertaken with Perficient Latin America.
Productivity
Common technical definitions of productivity consider person-hours as an input, and either SLOC[4] (Source Lines of Code) or Function Points as an output (a Function Point represents a normalized measure of software effort[5], or a unit of measure for software effort that separates software “size” from coding language).
Total Cost of Ownership depends on productivity in a straightforward manner. Here is a simplified example: Team A produces 2 units per hour, while team B produces 1 unit per hour. Team A charges $ 2 per hour, while Team B charges $ 1.20 per hour. Here, Team A is 66% more expensive than Team B. However, because Team A is twice as productive, so long as it charges less than twice what Team B charges, one is better off working with Team A. Clear enough, but how to measure this in the real world?
Luckily, Caper Jones has investigated this issue in depth. Recent productivity statistics from Prof. Jones, stated in Function Points, are as follows (they are taken from over 13,500 software projects in over 600 corporations of all sizes within the US)[viii].
Notice that the smaller the application, the higher the productivity per staff per month (which points to how hard it is to maintain high productivity in enterprise-class applications):
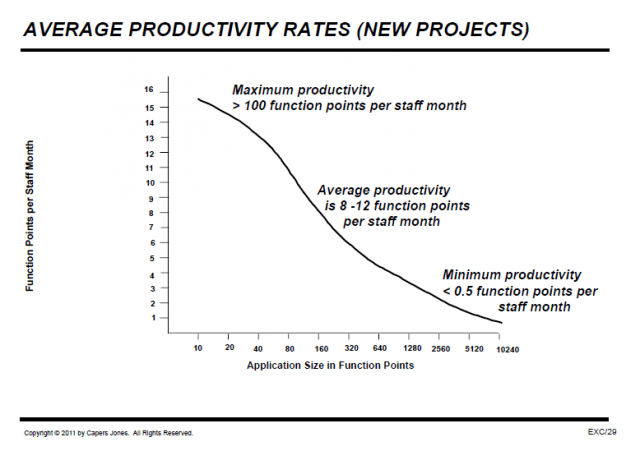
Optimizing the Total Cost of Ownership on an Outsourcing Software Development Project Part 2 photo 2
Unfortunately, comparatively very few companies have the discipline or process to measure their actual productivity, the reason for which statistics often turn mute. Perficient Latin America is one of those scarce few that does monitor productivity[6].

It is important to note that productivity statistics are tricky and can easily be misleading. Producing many Function Points of trashy and insecure code might be fast, but certainly does not lead to a low TCO. At Perficient Latin America, our productivity is bound by quality. We do not release code that is hard to maintain, that does not respect internal coding standards, or that is insecure. In fact, our net productivity metrics (discussed below) are inclusive of processes that filter for such type of code.
Going back to Caper Jone’s statistics, the following chart establishes typical productivity ranges for different types of applications:

Within the previous context:
Perficient Latin America average productivity under agile projects is of 40 to 60 Function Points per Developer per Month. This means Perficient Latin America is able to reach and exceed “maximum productivity levels”, as defined by Caper Jones in the studies quoted above.
Our above-par productivity is one of the key factors establishing Perficient Latin America’s ability to provide an exceptionally competitive Total Cost of Ownership for its clients.
Cost
At this point, we hope to have conveyed the message that the final cost of a software endeavor –it’s Total Cost of Ownership—is very much dependent on variables that go significantly beyond “sticker price”. Via short but telling examples, we have underscored how process, quality, risk (mitigation), and productivity all directly impact TCO.
With this in mind, let’s revisit Caper Jones and his statistics on Cost per Function Point within the United States:

The number we are interested in is “Fully Burdened cost per Function Point”, which includes not only salary pay but also basic infrastructure required for an engineer to perform his or her job.
Now, how does Perficient Latin America stack against these figures? According to our internal benchmarks, a (low) cost developer in the US can be hired directly for a fully burdened blended rate of US $ 75 per hour. Perficient Latin America’s blended rate to the client (which by definition is fully burdened) is close to US$ 37 per hour, our roughly half of the US rate.
Please note that the Function Point metric described here takes into account a cost per unit of effort, therefore, it reveals the true value of a vendor’s services. Thus, it’s a much better insight at value than “sticker price alone” (which does not take into account productivity).
Conclusion
It is not uncommon that clients, when seeking nearshore vendors, begin the conversation by asking “What are your rates?”. We like to delay answering this question not because it is not a valid inquiry, but because it may close doors early in the conversation that might otherwise lead the client to delve deeper into the value we provide.
As Latin America’s leader in the implementation of software engineering best-practices, Perficient Latin America’s strategy has diverged from providing the lowest “sticker price”. Quite the contrary, we have built our company on the promise of achieving the lowest Total Cost of Ownership for our clients, defined as a mix of process, risk management, quality and productivity that will produce the lowest cost throughout the life of a given software initiative, all things considered.
In an alternate world, Perficient Latin America could offer a very low sticker price by hiring less talented or less experienced developers, lowering its English threshold, allowing developers to work without a disciplined agile process, letting them code without standards, or deploying our services without stringent quality control.
Although this is the path taken by many of our competitors, we would never do this. This would betray our deepest technical convictions of what value means for our clients. We have been in business for over 30 years and know such a strategy would produce short term gains (if at all) in exchange for long term pain; it would foster no long-term relationships, no repurchase from our clients, and no pride of a job well done in our development groups. In short, working to offer the “lowest sticker price” would inevitably lead to failure.
For this reason, we stick to our guns, ensuring we remain a world-class software organization that provides the lowest possible TCO from Latin America to the world. We invite you to sample our services and see for yourself.
More on Perficient Latin America: Perficient Latin America is a nearshoring, 30-year-old IT services firm with offices in Colombia, Mexico, and the US that combines high-level process maturity with agile methodologies in order to reduce the Total Cost of Ownership of software development projects. Want to know more? Let’s start a conversation.
————————————
References
[4] Effective Lines of Code (ELOC) removes spaces, comments, and other lines which do not reflect the computer logic of the application itself.
[5] A Function Point is a unit of measure that expresses the amount of business functionality that is present in an information system, regardless of the language the software is written in.
[6] In their day to day, developers at Perficient Latin America log their hours and activities. Automatically, we crawl the code to take account of ELOC. We use these inputs to arrive at our productivity metrics for each developer, throughout the project. The effort involves a simple step and is painless for developers, in no way being cumbersome or deleterious to their speed in programming.
[viii] http://tinyurl.com/k2oqlk7