In the past few weeks, we created variety of reports starting from simple tabular reports to colorful pie charts to user friendly drill down reports. SSRS tool is very friendly and is developed to provide world class reports to the user community. While browsing through several business intelligence forums, I found couple of questions that have been asked a lot. A lot of users wanted to know how to create reports with one graph per page and how to have tabs named in that report. This article is dedicated to answering those questions.
This article is named “Easy Hacks” because both the problems can be addressed with few clicks. You will see how.
Question 1: How can I have 1 graph per tab?
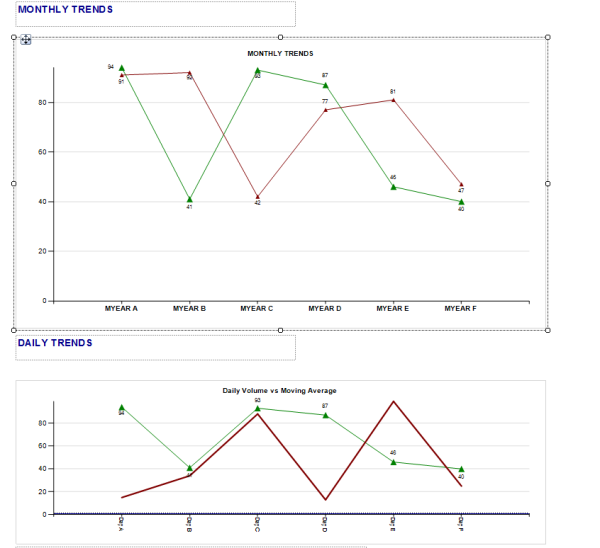
For our illustration purposes, I have created a dummy report with two graphs. You can create your own graphs to test these steps.
Select the first chart by clicking on it and select Chart Properties. Under the general tab, select “Add a page break after”
By adding a page break, we are making sure that the second graph will appear on the second tab. Adding a page break after every graph makes sure that the next graph appears on another page.
Easy, heh?
Question: How can I have named tabs on my SSRS excel report?
Firstly, you will need Report builder 3.0 to have named tabs on excel report.
Click on your chart and on your right under Chart properties, type in a name for your tab.
Export your report in excel format for named tabbed reports J
Stay tuned for more.


