SSRS report tends to hold maximum number of rows it can fit on a page. The number of rows varies according to the page size, row width, location of the table, etc. My report contains 99 records and these records are unevenly distributed throughout the report. The report I created holds 36 rows on page 1, 38 on page 2 and remaining on page 3. Today, we will learn to evenly distribute rows across several pages of the report.
I have created a simple table for illustration. This table contains 3 fields:
1.) ID
2.) Product_type
3.) Product_detail
I am querying all the records from my table and displaying the result in my SSRS table report. For those interested, here is the SQL query:
SELECT
*
FROM
[candle_soap_shop$]
My requirement is that I want to display 10 rows per page. This means I will have 10 rows on page 1 to 9 and the remaining 9 rows on page 10.
To do that, I will have to make groups of 10 rows and display these groups on different pages. It seems complicated but it really isn’t.
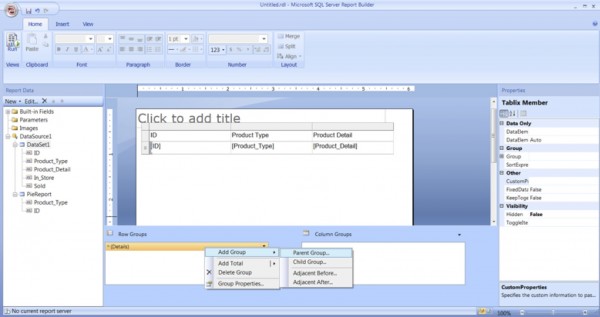
The first thing to do is right click on Details and click on Add Group and select Parent Group.
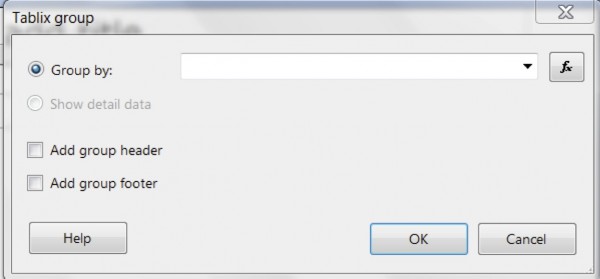
You will see a pop up window. Instead of choosing the options from drop down, click on fx. fx is a button to enter mathematical formula. This button is also found in Microsoft Excel.
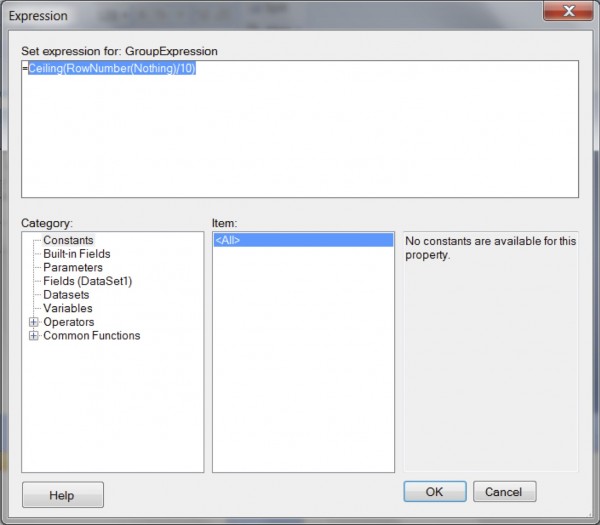
When you click on fx, a new window opens:
Type Ceiling(RowNumber(Nothing)/10) afer ‘=’ sign. I will explain the formula in a bit.
Let us break the formula piece by piece:
Ceiling is a function that will give us a closest integer greater than x.
For example:
Ceiling of 0.1 = 1
Ceiling of 1.1 = 2
Ceiling of 2.2 = 3
RowNumber(Nothing) – This denotes the row number of a record.
For example:
RowNumber(1) = 1st row.
RowNumber(2) = 2nd row and so on.
When SSRS runs the report, (nothing) is replaced by the numbers (1,2,3).
You must be wondering how this formula puts 10 rows on every page. Let me explain this with an illustration.
Ceiling(RowNumber(1)/10) = Ceiling(0.1) = 1
Ceiling(RowNumber(2/10) = Ceiling(0.2) =1
…………………………
Ceiling(RowNumber(10/10) = Ceiling(1) = 1
Ceiling(RowNumber(11/10) = Ceiling(1.1) = 2
Ceiling(RowNumber(12/10) = Ceiling(1.2) = 2
SSRS makes a group of result sets 1, 2 and so on and if you observe every group has 10 records.
If you are still confused, type the formula as stated Ceiling(RowNumber(Nothing)/10) and try to run the report. The report will error out and lets resolve this quickly so that you see what the formula in action.
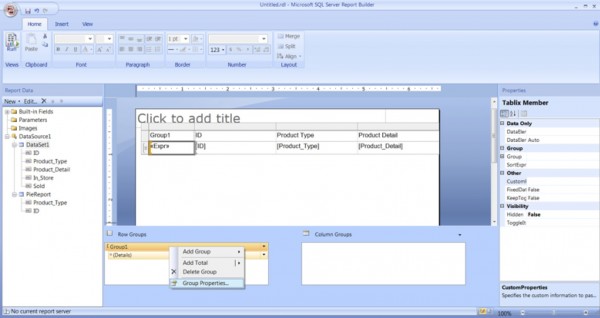
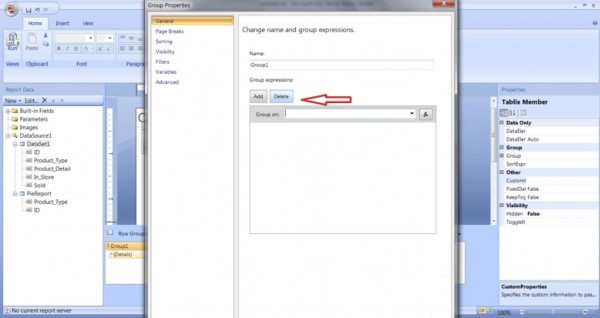
Right Click on Group1 and select Group Properties.
A new window will open. Click on Sorting and then remove the record by clicking Delete.
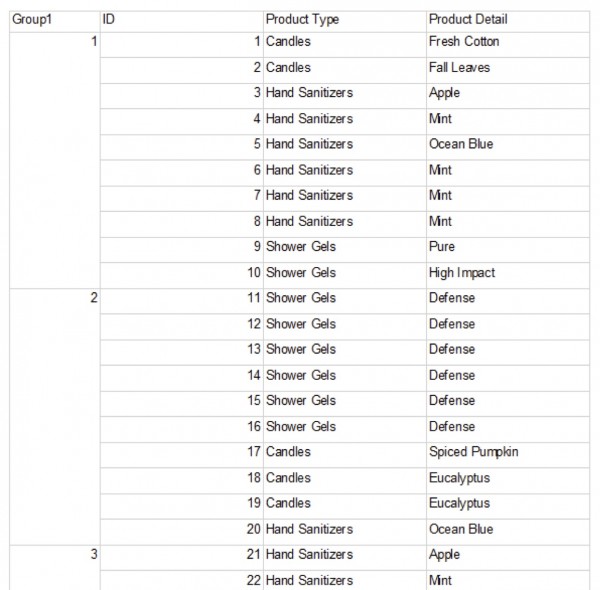
Run the report and see the formula in action.
We see that group 1 has 10 rows; group 2 has 10 rows and so on. In order to put these groups on different pages, we will have to add a page break between every group.
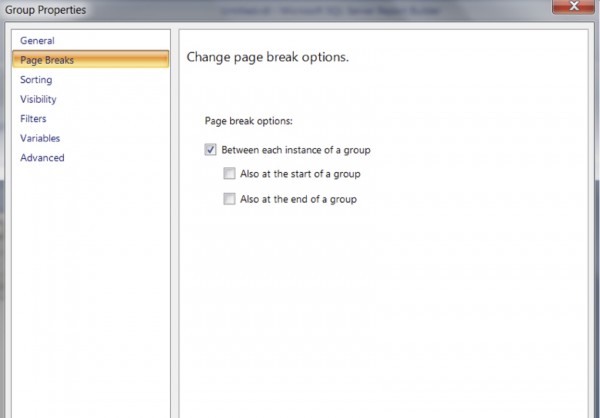
To do that, go to the home screen, right click on Group1, select page breaks and check Between each instance of a group.
You should now see a report with 10 rows on every page. If you don’t like Group1 column, you can delete it from the design page. Just remember to select, “Column Only” option.
Question: How would you display 6 records per page?
I will reveal the answer in my next article. Stay tuned J
