So we’ve created a sample, simple cube in Modeler (this cube has only 2 dimensions) and we want to load some data. To do that, you can (like in TM1 Architect) right-click on the folder “Processes”:
And then provide a name for the new process:
Performance Modeler now presents the “edit process” panel with the “Data Source” tab displayed as the open or current tab. Here you can browse to select your file to be imported and fill in the “Source Details” describing your file. These details include:
- Field Delimiter
- Starting Row
- Column Headers Included (yes or no)
- Quote Character
- Decimal and Thousands Separator and a
- Server File Location
Once you fill this information in, Modeler will show you the columns (fields) of data in your file and a “Data Preview”:
In this step you need to check the columns you want to import and also (very important) indicate the column that will be considered the “measure” (in my file it was column 3).
Importance Step!
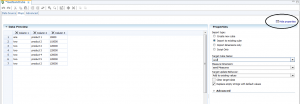
The next step is critical. You need to click on the “Maps” tab and then click “Show Properties” (in the upper right of the tab):
The properties tab opens and you must select the:
- Process Input Type
- Process Target Name
- Process Update Behavior
These properties are important, since the default behaviors of a new process created in Performance Modeler might not be what you expected. For my example, I chose to “Import to existing cube”, named my (target) cube, and “Add to existing values”.
Mapping
Performance modeler requires that you indicate what you want it to do with each column (field) in our input file. My file has only 3 columns:
When I designated my target cube, the mapping tab changed.
On the left we see the 3 fields in my input file and on the right I see the 2 dimensions in my cube and additionally, you’ll also see a “Values for”.
I needed to “drag and drop” my input columns (one at a time) to the dimension and level that they correspond or “map” to. Column 3 is the actual numeric value to be loaded and should be “mapped” to the “Value for” indicator:
Note: It’s always a good idea to SAVE your process after each change you make to its definition.
At this point, notice that you could click on the Advanced tab and add some custom scripting to the TurboIntegrator Prolog, Metadata, Data or Epilog tabs, but for this easy example, let’s just execute it.
Right-click (on the process name) and select Execute.
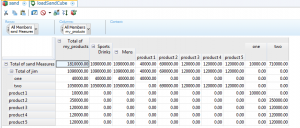
Now we look at the cube, we will see the results of our data load:
Terrific. So slightly different than build a load process in Architect, but it works. Next time I’ll show how I added custom scripting to this process and some other cool stuff.
Cheers!


