In a previous post (here) I posed the question regarding the difficulty we experience when implementing a BI project, and promised to address mitigating the pain that our project teams and clients typically experience. But before we can do that, we need to explore where the pain and difficulty comes from.
Difficulties:
– Unfamiliar technologies, black box processes and governance concepts are difficult to explain and when the business tries to visualize how these concepts interact with one another, the picture is cloudy at best.
– New business processes (e.g. drilling down in a dashboard vs. looking up a spreadsheet cell) have to be learned and the average age of our users don’t always bode well for this exercise.
– Fundamental ‘truths’ are often challenged with BI projects.
What do I mean by ‘fundamental truths’? The business is use to looking at their data through a very familiar lens. It could be Excel, it could be a report, but it’s familiar to them. They trust it. Or at least they know which pieces to trust. When a new way of viewing the data is introduced, it not only shines the light from a different direction (i.e. slice and dice), in some cases it exposes that their old trusted views were actually wrong. (and this is a hard conversation to have)
Now, we’re not forgetting that the actual development of the BI platform is difficult, but the people doing that actually enjoy that type of work, so it no longer factors into our discussion.
So do the difficulties described above actually cause pain, or do we generate that through poor management and communication of the project?
A recent study (here) published by the University of Chicago states that in fact, yes, some people experience physical pain when thinking they are faced with a math question.
A math question? Well we’re not asking them to do math are we?
Of course we are! Maybe we’re not asking them to recite Algebra laws but the only reason we’re doing business with them is because it’s too difficult or time consuming for them to produce their monthly reports the same old way.
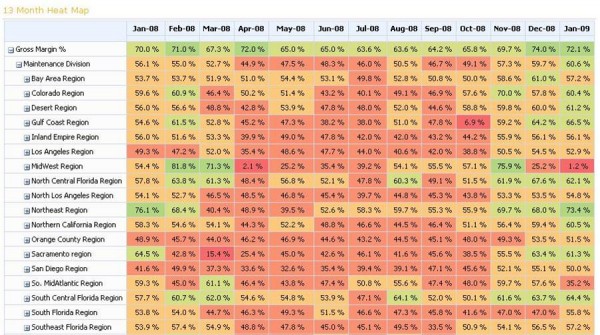
As a simple example of this issue, please verify that the dashboard below is correct by counting the number of red cells and we’ll compare your answer to the actual number later in the post.
Now, I didn’t expect anyone to actually count the number of red squares, but if you started to, I’m assuming the first thing you did was furrow your brow, squint your eyes and maybe put your hand to your head. If you actually counted them I’m assuming you now have the question of “Which shade of red were you referring to?” or “Why are there two shades of red? Is that a bug?”
Oh by the way, did anyone question why Apr-08 total GM% is so green despite the fact that it has so much red?
….. so does it feel like a math problem yet?
As you can see, this line of questioning could go on and on, and we haven’t even determined if any cells should be red because we don’t know what the algorithm is that decides the color, but for now we’ll have to trust the author.
In the next post we’ll start to explore how to reduce the trauma inflicted by this process, but in the mean time, if someone has the answer to the original question can you send it to me? I have a headache…

