You can find the previous posts to this topic here: Part 1, Part 2, Part 2.5
So how do we reduce the amount of anxiety related to a BI project (thus making them less painful)? To start, the project team needs to be keenly aware of the following:
They must consistently over communicate that some process change will happen and what it is.
Why must they over communicate? It takes time for people to assimilate new ideas, and this is only after they actually start listening. A standard metric in television marketing states that a consumer must make 3 ‘mental connections’ to a TV ad before deciding if the product is relevant to them. Is your process change more interesting than that TV ad?
Ensure that everyone feels they are in this learning process together. In other words, don’t let some users put themselves on an island.
We’ve all been in a class at some point where someone started to fall behind and was too embarrassed to raise their hand, again. Don’t let your users fall behind.
Realize that the mechanical capabilities of moving through a new report or dashboard are not inherent in all users and may demand ‘more obvious’ training.
I just finished reading an interesting article about technology anxiety in an older workforce and the study cited interface design as a leading cause of anxiety; specifically the practice of designing an interface with a ‘layered menu’ system in which the user must remember that there are ‘invisible options’ and the sequence of actions to find them. Dashboards typically employ this functionality through the ‘right-click’ context menu.
I immediately thought of the introduction of the Microsoft ‘ribbon’ and if the ‘invisible option’ problem wasn’t a leading factor in that design change.
Finally, be prepared for the data anomaly effect.
I’ve written about this before but it remains to be relevant. Users of a new analytical platform need to be prepared for the fact that they will be faced with data anomalies. Some of these anomalies will turn out to be actual bugs, but some will not. Those that are not obvious bugs will require research. Research means delayed responses back to the business and delayed responses mean a frustrated business user, if the project team has not embraced the recommendation of over-communicating.
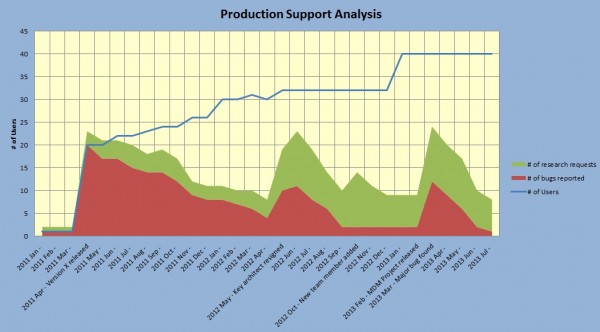
Over time, the number of bugs will decrease, but the number of research requests is likely to increase (as shown in the example below) especially as new users are rolled on.
Additionally, there are a series of events that can cause these numbers to fluctuate. Version releases are an obvious source for bugs, but what about a key team member leaving?
In the example below, during October of 2012, we see a spike in research requests but no spike in bugs and no additional users added. The only major event that occurred was a new member joining the team. We can infer that either the previous support person had direct lines of communication open to the users (very likely that hallway discussions answered some users questions) or that the new team member is recording ‘discussions’ differently. Regardless, this event may be a source of frustration to the business that has no direct tie to the functionality or stability of the system.
In conclusion, there are a number of reasons why a BI project can be difficult to implement, but not all of them are related to ‘BI technology’ per se. Challenging fundamental truths, brain pain and good old fashioned learning anxiety play a big role in the perceived success of an implementation.

