
Power BI Buckets or Groups help you to create a range of data, when you are creating visuals in power BI, it aggregates your data into chunks (or groups) based on values found in the underlying data, but there may be times when you want to refine how those chunks are presented. For example, you may have age column and you want to show ages in groups e.g. 0-25, 25-50, 50-75, 75-100.
There’s a couple of ways you can do it. Before I show you what I did in Power Query let’s talk about the traditional ways that people create buckets.
The first way is to create a bucket in the source, for example: SQL, the bucket is part of ETL process so if you have access to the source you can directly create there in the source, otherwise it can be created by the ETL team.
If you don’t have Access then you got couple of choices. Let’s talk about some of them.
Another way that I see people do it by using DAX, they use SWITCH or IF condition or something like that, it specifies if the age is less than and equal to 40 then result will be “20-40” and if the age is between 40 to 60 it will show you “40-60” and so on.
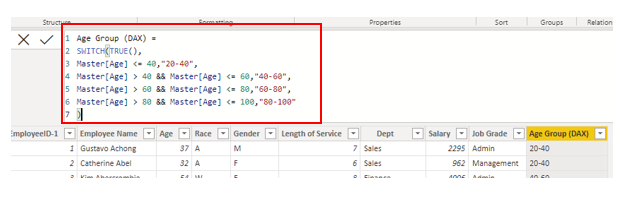
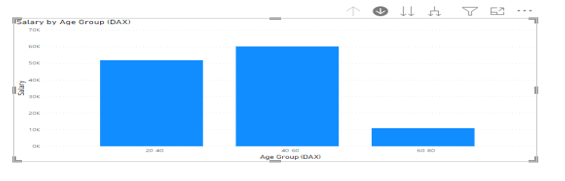
After creating calculated column drag it into the canvas it will give you the expected result.
So, in the case of DAX, Calculated columns with a high cardinality can affect the model size and the refreshing ability. But, this is such a low cardinality its definitely an option you can consider.
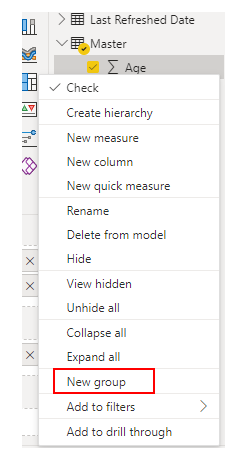
Another way is you can use the grouping feature inside of Power BI.
You can go to the age column or any column you want to apply this grouping, right click on it you’ll find New Group option
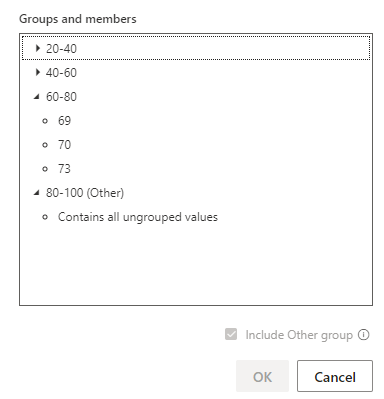
It will Popup the new window where you can create your own group by selecting random age or range of age group.
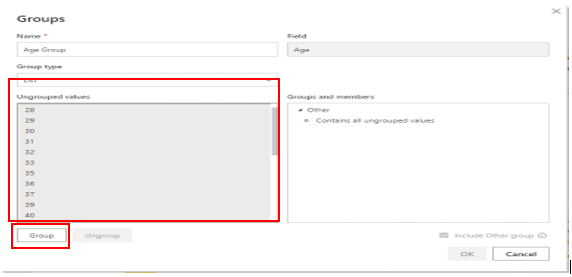
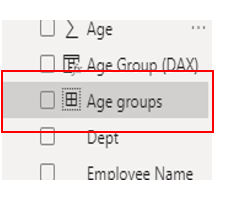
In the right side you will find your groups created, you can rename the group name by double clicking on it and say OK it will appear on fields section in power BI window.
These are three ways to create groups In Power BI.
How can we create groups in Power Query?
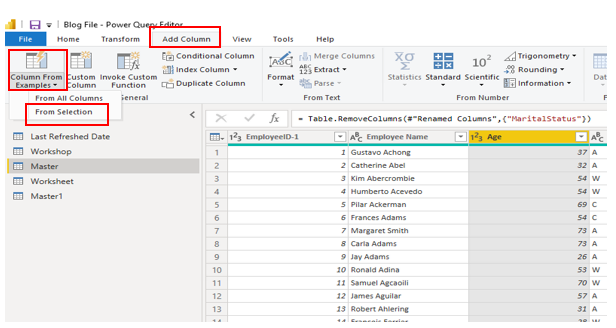
To create groups in Power Query, click on Transform tab it will take you to power query editor, select the column on which you want to create a group of range then click on Add Column -> Column From Example -> From Selection.
When adding a column from examples by selection, Power Query offers a helpful list of available fields, values, and suggested transformations for the selected columns.
The Blank column is added, rename the column name as Range.
Enter “20-40” as a range in the first blank cell and hit enter, it will automatically create a range according to the ages.
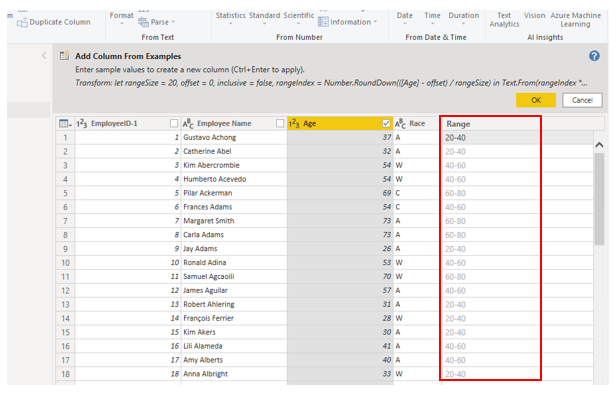
It will show you the suggestions, if you are satisfied then select OK.