
What is Monitoring
Monitoring is a feature in IIB, which enables the developer to configure the flow to emit events when something interesting happens. These events can either be stored in a DB or consumed by monitoring applications such as Websphere Business Monitor for auditing and replay of messages.
Features
IIB flows can be configured to generate two types of events.
- Transactional Events – Events emitted by input node. To indicate the state of the transaction. When configured, transactional events are emitted under three circumstances
i. Transaction Start – To indicate the start of transaction
ii. Transaction End – To indicate the end of transaction
iii. Transaction Roll Back – To indicate failure
- Terminal Events – Events generated by the terminals in any node, including the input node.
The point at which an event is triggered, is termed as event source. In case of terminal events all the terminals that are active to emit events become terminal event sources. The input nodes have a transactional event source in addition to the terminal events. Input nodes can be configured to generate both terminal and transactional events.
Monitoring Profile vs Monitoring Properties
Monitoring can be Created/Configured, Enabled or disabled by using any one of the following methods:
- Monitoring properties in the node
- Monitoring profile configurable service
Monitoring Properties
Monitoring Properties can be used when the events are customized during the design phase. The events can be configured using IBM Toolkit’s Message flow editor. Any node that supports monitoring, has a tab in properties called “Monitoring” for customization. The Monitoring properties are deployed in the bar file as part of the Message flow. If there are any changes in the event configuration, the properties are altered in the flow and re-deployed.
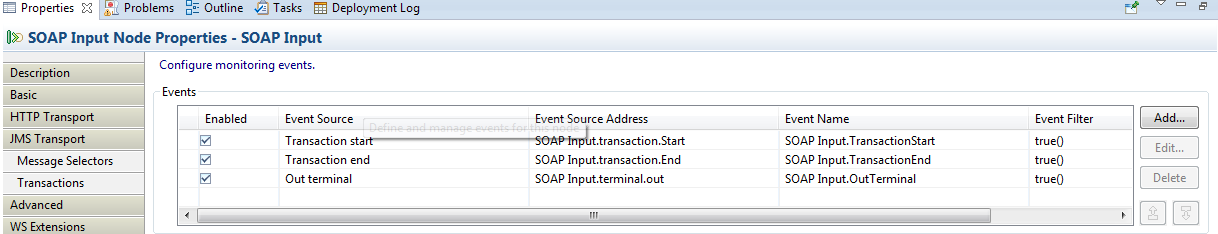
To Add Monitoring events, go to the Monitoring tab in Properties view, and click on the Add button.
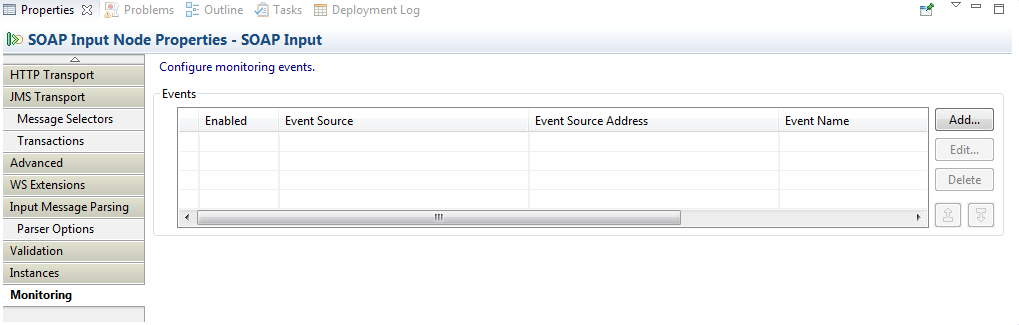 After clicking Add Event, the below window opens. It has three tabs for configuration.

The basic tab has details on
- the type of event (Event Source) – Terminal or Transactional Events
- Event Source Address – Depending on the type of Event source, the address is populated as read only property.
- Event Name – The name for the event, which could be a constant/Literal, or can be pulled from the payload.
- Event Filter – Events are generated only when the event filer evaluates to true(). The filter can be configured to evaluate an xpath, and depending on the value, the event can be published/suppressed.
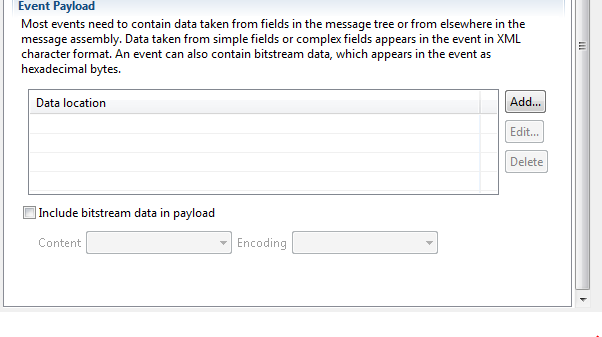
- Data Payload – In addition to the general data, for auditing any business related data/or a particular field in the payload has to be captured, that can be achieved by adding the payload data location.
- Include Message Data – Use this option, if the entire message has to be captured for future reference.

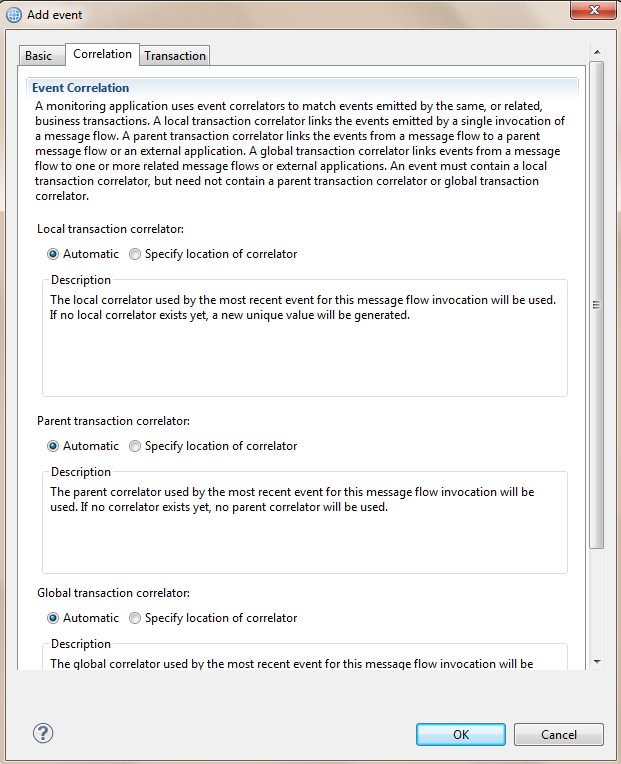
 The Correlation tab has three types of Correlation:
Every monitoring event must have at least one type of correlation. Local, Parent or Global. The Values can be set Automatically or can be pulled from the specific location in the message tree using the Xpath Expression Builder.
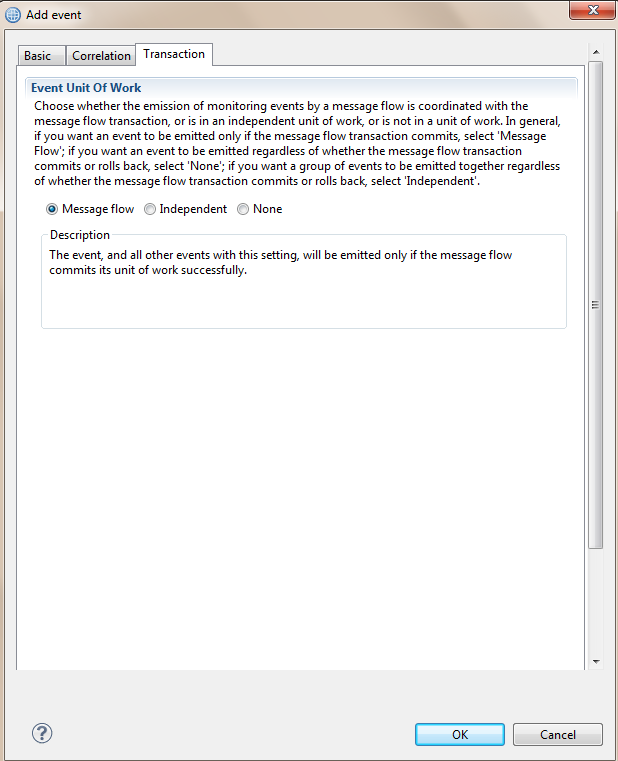
The last transaction tab is optional, and can be used to configure how the events from the message flow are coordinated. It could be a Message flow transaction (Message Flow) or an independent unit of work (Independent) or not in a unit of work (none).
The events created can be enabled or disabled by checking/unchecking the enable box in the Monitoring tab of the Properties view.
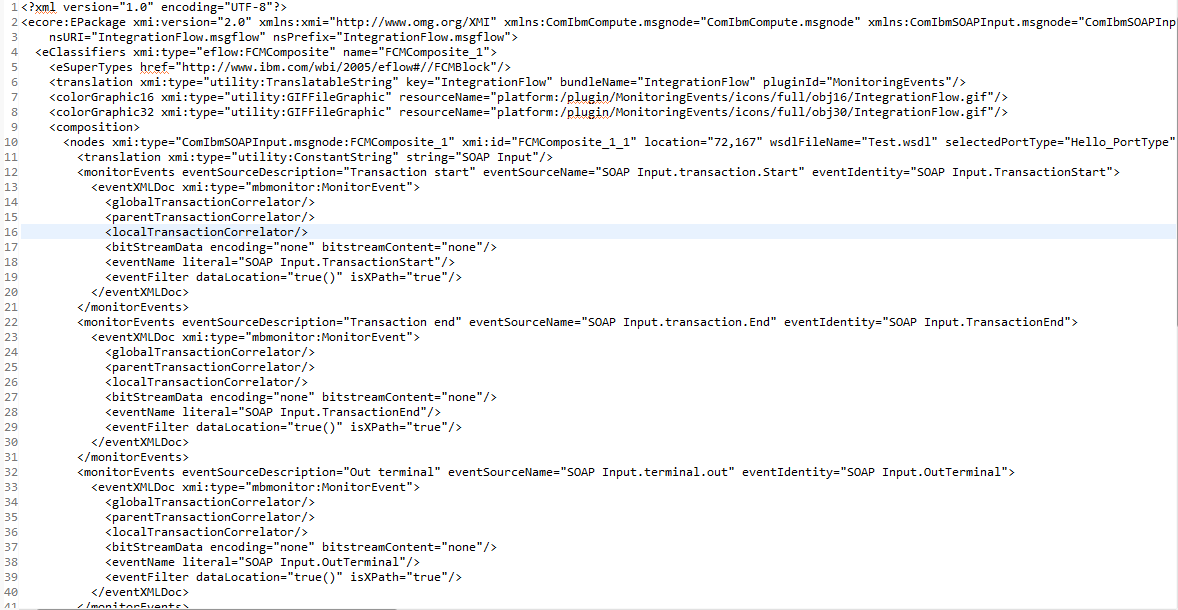
 On opening the message flow in the text editor, the configured monitoring events can be viewed in xml format.
Monitoring Profile
Monitoring profile is the xml representation of the monitoring events configured in the nodes. One main advantage of using monitoring profile is that, since it is a configurable service, any changes made to the profile don’t require any deployment, whereas changes made at the node level require a re-deployment. The monitoring profile takes precedence over the monitoring events configured in the message flow. Another advantage of Monitoring profile is that, a single monitoring profile can be used for multiple flows. The profiles aren’t deployed in a BAR file, it is created directly on the Integration Node/Broker.
The MonitoringProfile.xsd defines the structure of the monitoring profile xml. The schema and a sample profile can be found in,
Install_root/server/sample/RecordReplay/MonitoringProfile.xsd
Install_root/server/sample/RecordReplay/basicMonitoringProfile.xml
The monitoring profile can be created from the IIB web console, as it is a configurable service. Once created, use the below commands to link the monitoring profile to the flows.
Linking Monitoring Profile to Application/Messageflow
mqsicreateconfigurableservice <Broker> -c MonitoringProfiles -o myMonitoringProfile
mqsichangeproperties <Broker> -c MonitoringProfiles -o myMonitoringProfile -n profileProperties -p <MonitoringProfile.xml>
mqsichangeproperties <Broker> -c MonitoringProfiles -o myMonitoringProfile -n useParserNameInMonitoringPayload -v TRUE
mqsichangeflowmonitoring <Broker> -e <EG> -k <AppName> -f <FlowName> -m <MonitoringProfileName>
-g => to implement for all Execution Groups
-j => to implement for all applications in an execution group.
mqsichangeflowmonitoring <Broker> -g -j -m <MonitoringProfileName>
Activating monitoring
Deploying message flows with monitoring properties enabled or associating monitoring profile doesn’t help in generating events. Use the below command to activate monitoring. Irrespective of using monitoring profile or using monitoring in the nodes, the below command should be executed. Also, please note that the below command must be executed for every new deploy.
mqsichangeflowmonitoring <Broker> -e <EG> -k <AppName> -f <FlowName> -c active
mqsichangeflowmonitoring <Broker> -g -j -c active
mqsichangeflowmonitoring <Broker> -e <EG> -f <FlowName> -s "Node1_Label.terminal.out,Node2_Label.terminal.in" -i enable
Verify monitoring
Execute the below command to check on the monitoring status
mqsireportflowmonitoring <Broker> -e <EG> -k <AppName> -f <FlowName>
mqsireportflowmonitoring <Broker> -g -j
mqsireportflowmonitoring <Broker> -e <EG> -f <FlowName> -k <AppName> -s "Node1_Label.terminal.out,Node2_Label.terminal.in"
Subscribing to Monitoring
The events generated by the flows must be consumed by the applications. The monitoring event feature leverages the publish/subscribe (pub/sub) mechanism of Message Broker. Event messages are published to the specific topics, which can be registered by subscribing applications. The form of the topic name is:
$SYS/Broker/<Broker>/Monitoring/<EG>/<flowName>
The topic hierarchical structure enables subscribing applications to filter the events. For example, one application can receive events from all message flows deployed on all execution groups in a broker, while another can receive only the events from all message flows in a single execution group.