
Introduction:
When Oracle Business Intelligence is installed, functionality for users to see maps that display data is also installed. Before users can see maps in analyses and dashboards, one must understand the system requirements, specify layers and maps, and configure the metadata. This post will explain the steps to configure mapping and spatial information for map views in Oracle Business Intelligence. This also gives business users a never before experience of analyzing data in spatial format, thus taking the interaction level with OBIEE on a different level, altogether.
Concept(s):
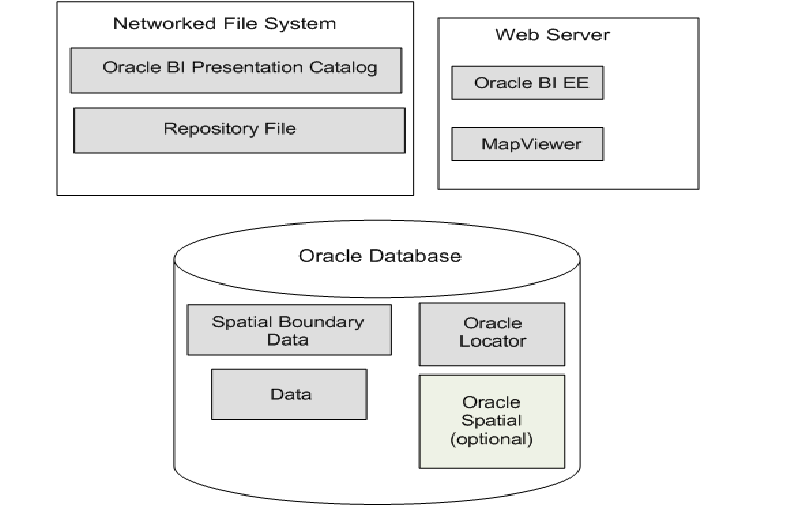
- Oracle MapViewer is a J2EE service and it serves as an engine for rendering maps using spatial data managed by Oracle Spatial. MapViewer is installed as part of Oracle BI EE and deployed in the same domain as Oracle BI EE on the web application server.
- MapViewer is designed to integrate with Location-Based services and applications.
- NAVTEQ is one provider of this spatial data to Oracle customers, which can be downloaded from the Oracle Technology Network. This spatial data and any other spatial metadata, including themes and styles, must be stored in an Oracle Database (10g or later) to be accessed by Oracle MapViewer for display in map views.
- RCU schema can also be used to store spatial data provided that it is an Oracle DB.
- Terms and Conditions of Use: http://elocation.oracle.com/elocation/legal.html
Basic Architecture for MAP views:
Applies to:
- Business Intelligence Server Enterprise Edition – Version 11.1.1.3.0 [1905] and later
- Business Intelligence Suite Enterprise Edition – Version 11.1.1.3.0 [1905] and later
- Oracle Fusion Middleware MapViewer – Version 11.1.1.4.0 and later
- Any platform
- Only OBIEE Administrators must follow this document
To implement, we need to follow the below mentioned steps in the given order:
Step 1: Creation of World Sample Demo Schema
- Download the spatial schema provided by NAVTEQ from the following location (world sample data bundle) : http://www.oracle.com/technetwork/database/options/spatialandgraph/downloads/navteq-data-download-168399.html
- Log in to the Oracle database as system admin user and create the world_sample database user/schema: CREATE USER world_sample IDENTIFIED BY world_sample DEFAULT TABLESPACE USERS TEMPORARY TABLESPACE temp QUOTA UNLIMITED ON USERS.
- Grant privileges: GRANT CONNECT, RESOURCE, CREATE TABLE, DBA TO world_sample IDENTIFIED BY world_sample.
- To begin, run the sql script (after unzipping the downloaded file) in Sqlplus session. Exit the Sqlplus session after the script has successfully concluded. Check that file = “filename.dmp” is same in the unzipped folder. If not edit the file as below with correct name. host imp world_sample/world_sample file=world_sample2010.dmp log=world_sample.log full=y
- From the unzipped folder place the dmp to a location in the server. This is a database dump file exported from an Oracle database.
- Open a command window, change the directory to the location of world_sample.dmp, and use the following command to import the data into user world_sample: imp world_sample/world_sample file=world_sample2010.dmp full=y ignore=y
- During import the following messages should be displayed:
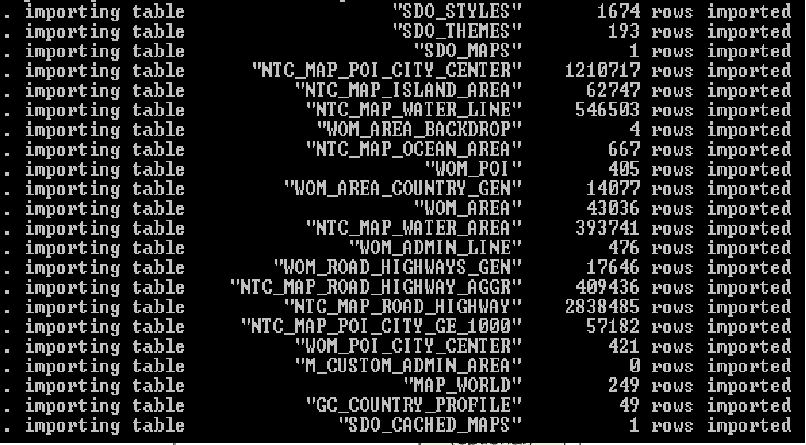
- Make sure the world_sample schema has loaded successfully
NOTE: This world_sample schema is created ONLY for the purpose of storing spatial data. This data is not supposed to be used by answers/analysis for reporting purpose. So for converting data into Maps within reports another database/schema (DWH) must be there from where data is fetched into the reports. DWH schema should be entirely different from world_sample.
Step 2: Creation of Dummy DWH Schema
- To create a dummy DWH schema, execute the following script using any Admin user. CREATE USER obieemap IDENTIFIED BY obieemap DEFAULT TABLESPACE USERS. So here OBIEEMAP would be considered as DWH schema.
- Grant privileges to the obieemap user. Use the following script for reference: GRANT CONNECT, RESOURCE, CREATE VIEW TO obieemap IDENTIFIED BY obieemap
- Copy the dump file http://www.oracle.com/webfolder/technetwork/tutorials/obe/fmw/bi/bi1116/obiee_maps/files/obieemap.dmp to a particular location in the server.
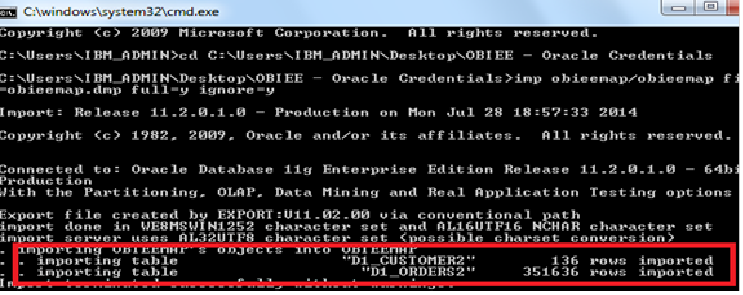
- Open a command window, change the directory to the location of obieemap.dmp, and use the following command to import the OBI data into user obieemap: imp obieemap/obieemap file=obieemap.dmp full=y ignore=y
- Confirm that the following tables have been imported with data.
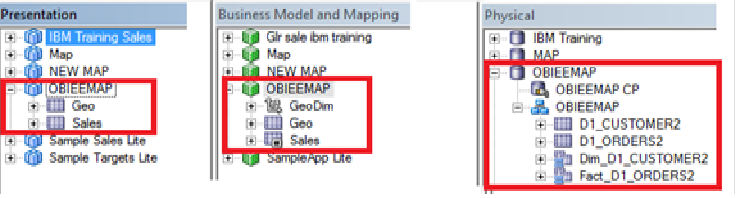
- Download the sample rpd from http://www.oracle.com/webfolder/technetwork/tutorials/obe/fmw/bi/bi1116/obiee_maps/files/OBIEEMAP.rpd and merge with the current rpd deployed to the server. The following physical, BMM and presentation layers will be imported.
NOTE: Remember, creation of OBIEEMAP schema during setting up Map integration is NOT mandatory as a DWH schema would already be in place in an existing environment. Only the data-points (e.g. City or State Code etc) by which spatial data and information from data warehouse are linked should be in SAME format i.e. data-types, format of the values, case sensitivity should be identical. Here in this document, this schema has been created for the sole purpose of providing a demo the developers on how to set up the integration
Step 3: Creation of MAP viewer data source
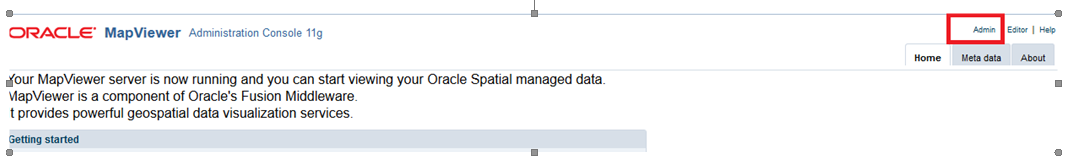
- Open a browser and enter the following URL: http://host:port/mapviewer. Click the Admin link in the upper right corner to open the Login screen.
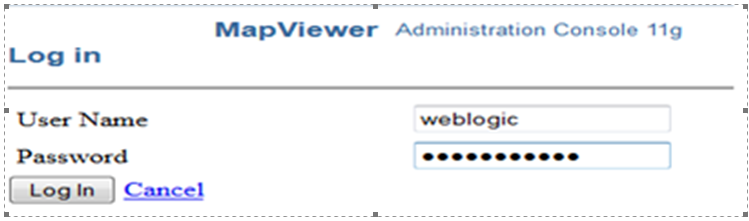
- Log-in as an Administrator.
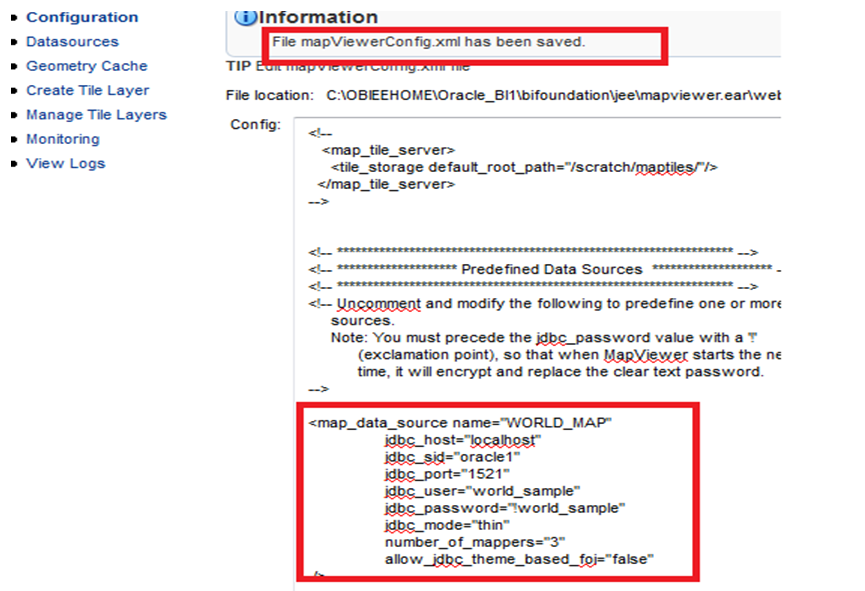
- Select Management > Configuration to open the Map Viewer XML configuration file inside a text area. Scroll all the way down to the end of the file to find the sample Map Viewer data source definition: “map_data_source name=”. Make sure to put the same database credentials as world_sample schema and put a ‘!’ sign prefixed to the password as shown below. Once the entire details have been entered click on Save button and see the confirmation message at the top.

Guide to Oracle Cloud: 5 Steps to Ensure a Successful Move to the Cloud
Explore key considerations, integrating the cloud with legacy applications and challenges of current cloud implementations.
- Click on Save & Restart button. Map Viewer will restart, reload this configuration file, and the world_sample data source will be created. If it doesn’t restart after clicking on this button (a message pops op saying it can’t be restarted) then go to EM and restart all BI services.
![]()
- In existing Data sources Tab within map-viewer an entry with the name “WORLD_MAP” will be added.
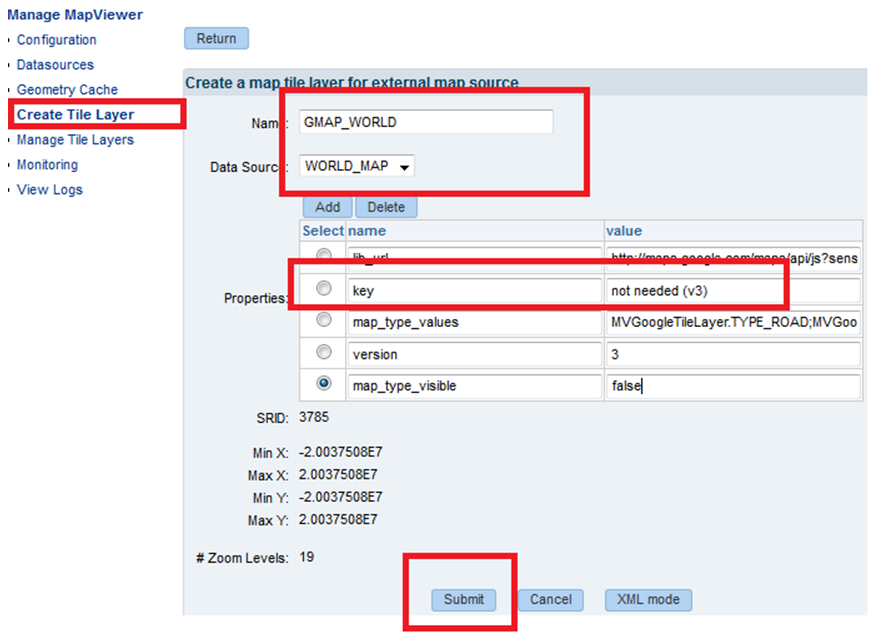
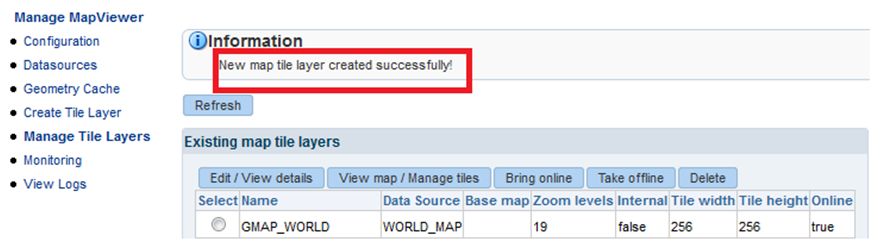
- Go to Create Tile Layer -> Select Google Map from dropdown as the map type -> Give a name of the tile (such as GMAP_WORLD)-> Select WORLD_MAP as Data Source -> enter the following details as shown below and click on submit. Please note that in Key attribute one may enter ‘not needed (v3)’. In that case whenever a map is shown to the user within OBIEE a popup will be thrown asking to get the API code for Google map. One can generate the API following the instructions provided in the URL https://developers.google.com/maps/documentation/javascript/tutorial corresponding to a Google mail id and enter the same API in this Key attribute value. In that case, no popup will be generated.
- A new map tile layer will be generated under Manage Tile Layers
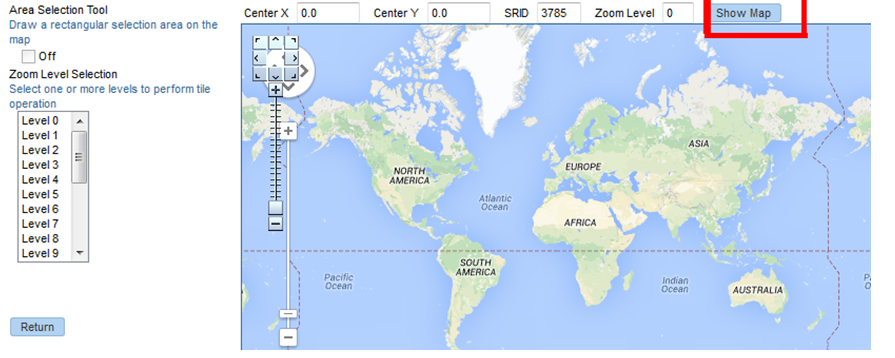
- Select the map tile, click on ‘View Map/Manage Tiles’ button. The click on ‘Show Map’ button again to see if the map works properly. If the API code is not entered as per mentioned in point number 6, a pop up message will be displayed as said earlier.
- Return to the previous page and click on Bring Online button. See for the confirmation message being displayed.
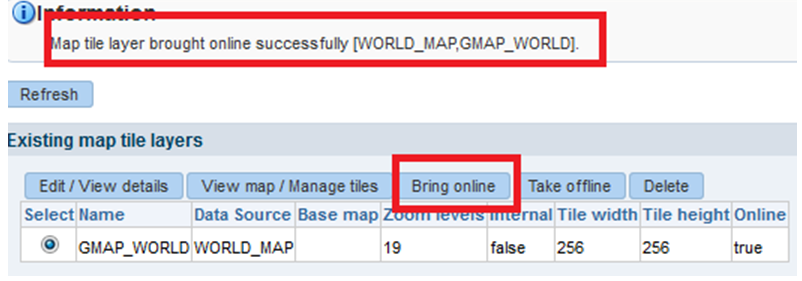
- Map viewer data-source is created successfully.
Step 4: Integrating MAP with OBIEE subject area
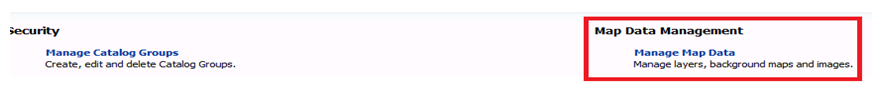
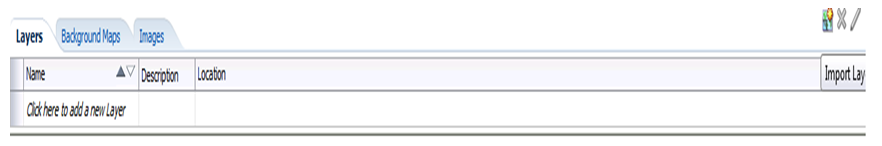
- Login to OBIEE as an administrative user -> go to Administration link at the top right hand corner -> click on Manage Map Data.
- Under Layers tab click on Import Layer button at the right.
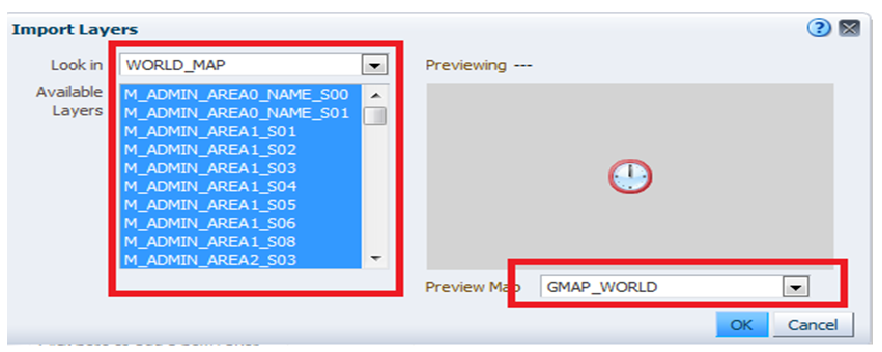
- Select all the necessary Available layers under the WORLD_MAP datasource/ GMAP_WORLD map and click on OK. Here all of the available layers have been selected.
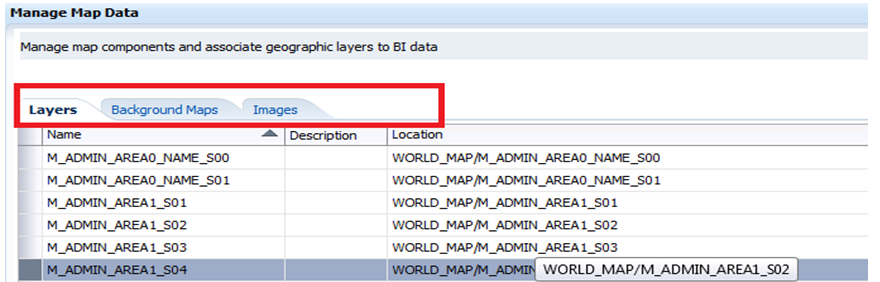
- Once all the layers have been imported successfully follow the same steps for importing Background Maps and Images as well.
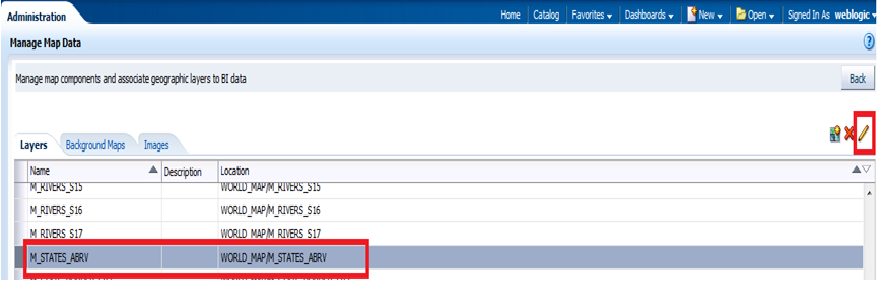
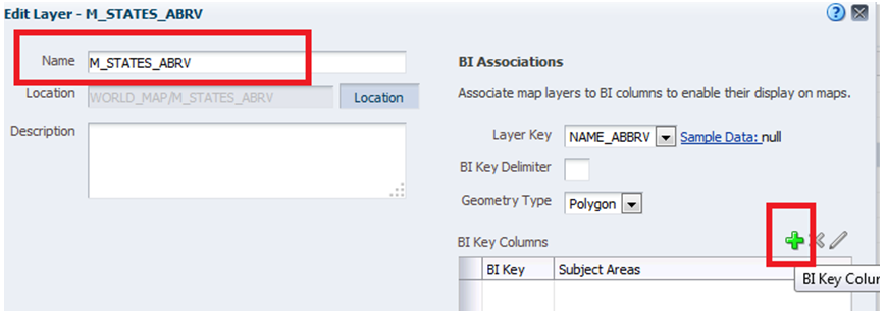
- Once all the layers have been imported select a particular layer (M_STATES_ABRV here) and click on Edit link
- Now under Edit Layers click on the ‘+’ i.e. add BI Key Column link as shown.
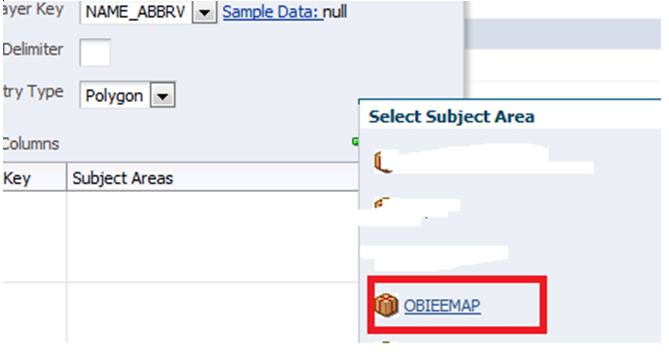
- Select the OBIEE Map subject area (that stores the BIDW data: Step 2 point 6).
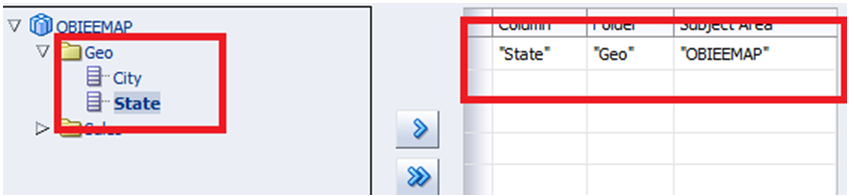
- Select the State Column as shown. Remember here we are editing M_STATES_ABRV layer and thus we are mapping state column to this. If we would have mapped any layer specific to City code then we would have mapped the City column shown here. Also a very important point needs to be verified: the data type for these matching columns should be identical in both the databases. The DWH and spatial database. Also the data value should be same for lookup as well.
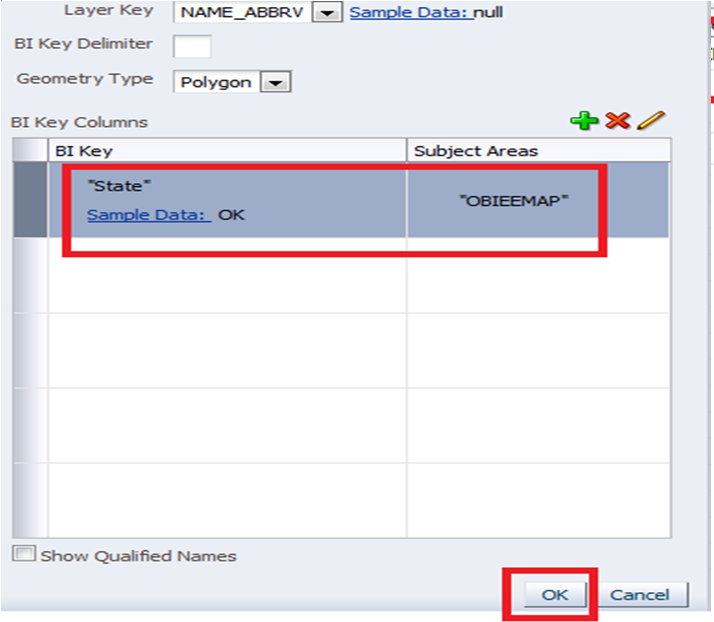
Now, the layer is mapped to a BI column. Like this all the layers could be mapped to BI columns as per requirement.
- Click on Sample Data under BI Key and it should return some value such as ‘OK’ or ‘NY’ or something. Shouldn’t be blank. Showing some value indicates that the integration is successful. Click on OK. The layer is now linked to this BI column.
- Go back to the Background Maps Tab, select the already imported Map (GMAP_WORLD here) and click on Edit link.

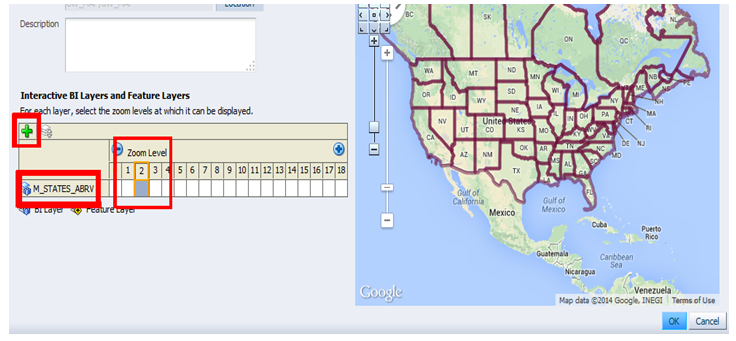
- Initially there won’t be any entries under Interactive BI Layers and Feature Layers Click on the ‘+’ sign as shown, select the necessary layers (here M_STATES_ABRV) and select a zoom level. The preview will be shown at the right hand panel. Once happy with the zoom level click on OK.
Step 5: Creating analysis and viewing maps
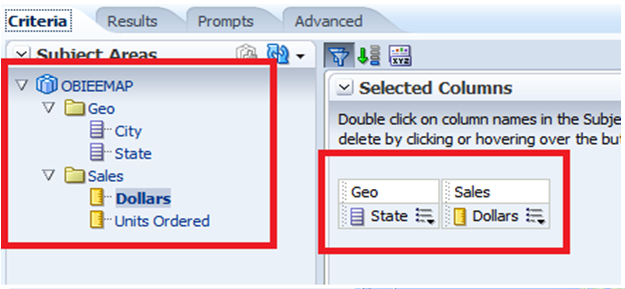
- Create a new analysis using OBIEEMAP subject area as shown. Drag the State and Dollars column as shown.
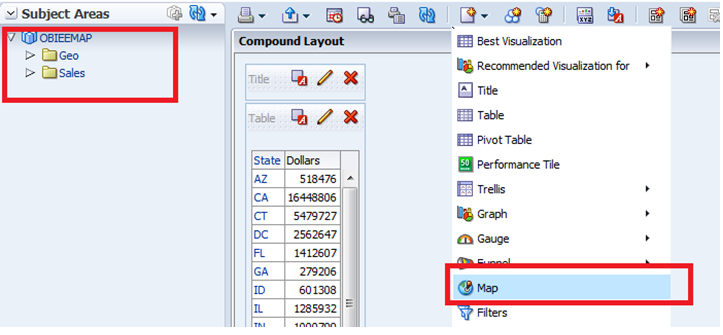
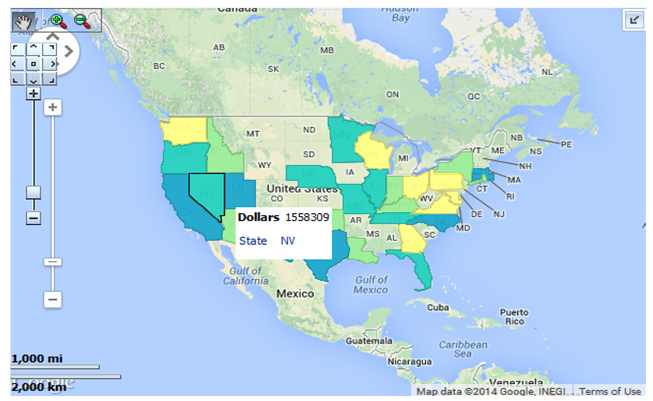
- Go to results tab. Data will be displayed as shown below. Click on Add View link -> Select Map from the dropdown.
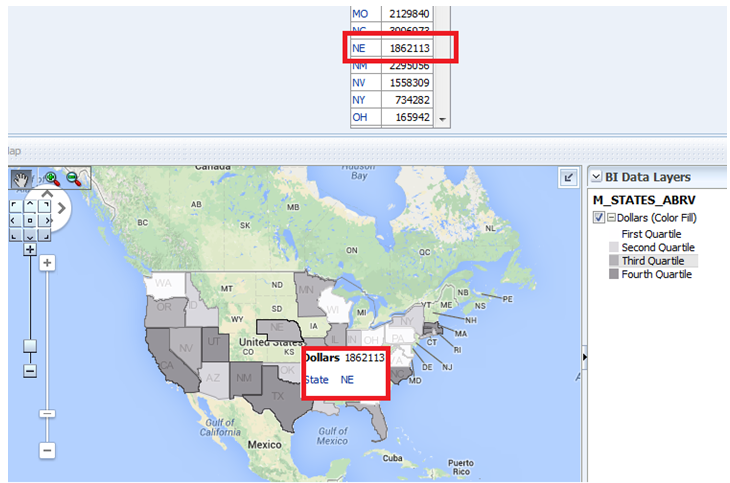
- A Map featuring states will be displayed. Hovering over the states within the Map will show Dollars data correctly. As shown, within tabular view for State ‘NE’ Dollar amount is: $1862113. In Maps as well we can see the same amount of data when we hover on NE state.
- Click on New –> ‘Color Fill’ on the map View and select ‘STATE_ABRV’

- Select required color from the window and check the check-box ‘Allow Dashboard users to edit Thresholds’.
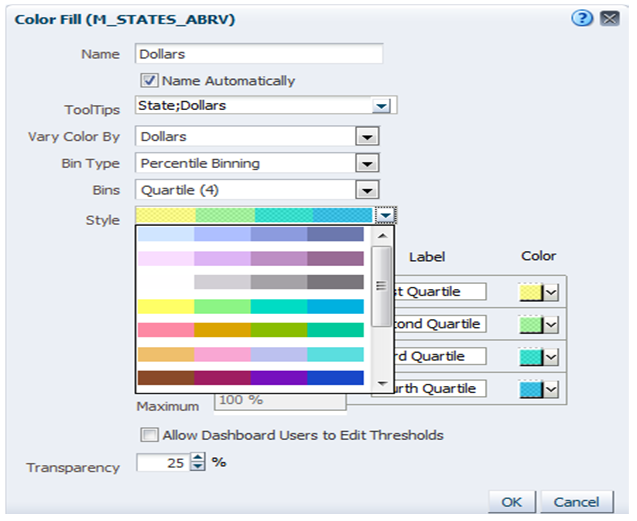
- The map is now updated with Quartile colors.
Assumption(s)/Note(s):
- NAVTEQ data dump provided by Oracle has data specific for specific countries. See : http://www.oracle.com/technetwork/database/options/spatialandgraph/downloads/navteq-data-download-168399.html . If any other country is needed to be shown within the report maps then contact Oracle for the same.
- As of now we have tried this on Oracle (Spatial) to Oracle (DWH) database connectivity. As we know spatial data can only reside in Oracle database, Oracle to Other database (such as SQL Server 2008 R2 etc) hasn’t been tried yet. Once done we will remove this constraint as well.
- Oracle (Spatial) to SQL Server (DWH) is under progress.
- On certain WLS domains one may see errors when trying to preview tile layers (500 – internal server error). To fix this issue, modify the weblogic.xml descriptor file found in $BIEEHOME/Oracle_BI1\bifoundation\jee\mapviewer.ear\web.war\WEB-INF folder, and un-comment the entry for the jstl 1.2 library as shown below (note the jsf section should remain commented-out):
<library-ref>
<library-name>jstl</library-name>
<specification-version>1.2</specification-version>
</library-ref>
like:
<!–
<library-ref>
<library-name>jsf</library-name>
<specification-version>2.0</specification-version>
<exact-match>false</exact-match>
</library-ref>
— >