As we wind down 2014, I’m taking a look back at some items in my reading list and bringing forward the ones I found important from a learning standpoint. The article The Problem with Sentiment Analysis by Sarah Kessler at Fast Company in November 2014 qualifies as one of those “aha” articles.
Analyzing social media has been a hot topic in the past couple of years. Ms. Keller points out that during the 2012 presidential election season USA Today had a daily story about President Obama’s “sentiment” score versus Mitt Romney’s score. The score was calculated by analyzing social media posts about each candidate. In theory, the analysis could show which candidate is getting more positive comments versus negative comments. And, in theory again, this could tell us about public opinion for each candidate.
However, Ms. Keller interviewed Marc Smith who pointed out that this type of sentiment analysis is inherently flawed. Marc Smith is a sociologist who specializes in the social organization of online communities. He went so far as to say about the USA Today stories that “This is remarkably poor data. That this is borderline criminal.” As Keenan Thompson says in Saturday Night Live, “What up with that?”
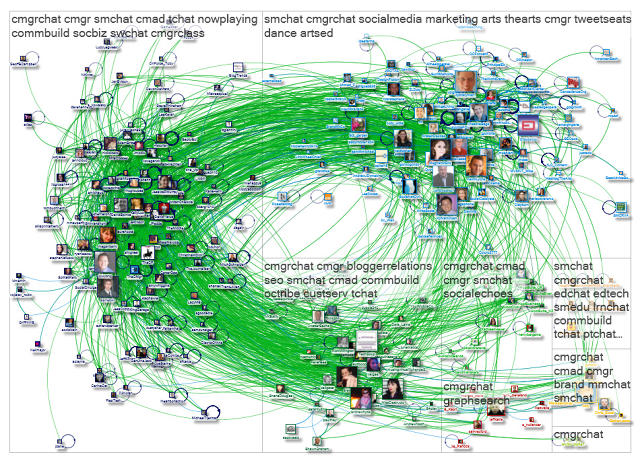
Tight Crowd Pattern Graph: NodeXL Graph Gallery

Mr. Smith argues that this type of sentiment analysis only reveals which group of supporters “shouted” the loudest that day. It really tells us nothing about public opinion of either candidate.
What I found really interesting is Mr. Smith’s work on how crowds form around a topic on social media in six different shapes:
- Polarized crowd in which two groups form and rarely interact with each other. This is akin to the political sentiment described above. The Obama crowd did their thing and the Romney crowd did theirs independently.
- Tight crowd where a small group of people cluster around a conference. The image in this post shows a tight crowd pattern.
- Brand cluster in which people talk about a brand, but rarely interact with each other in the crowd
- Community cluster where multiple small groups form
- Broadcast network in which many people connect with a media outlet, but not with each other
- Support network where something like a service center connects with lots of people, but those people don’t really interact with each other.
According to Mr. Smith, looking at the shape of the network lets you see that not all social media posts can be treated the same. He argues that you should report on the size, volume and content of each major cluster over time.
This makes a lot of sense to me. If you are measuring sentiment for a particular brand, event or anything else, you should be interested in how the network aligns with your goals. Say you are hosting a conference – you’d want to see the social network form into a “tight crowd” pattern. If it doesn’t then something is probably not working right. Likewise if you are a brand and see the “brand cluster” pattern emerge, you may want to take steps to encourage your followers to interact more with each other, if that is a goal.
If you are involved in sentiment analysis or any social media analysis, I encourage you to follow the links here and take a look at Marc Smith’s research in this area. Let me know what you think.