
Business Integration (BI) combines two parts: one is to build a data warehouse, the other is to build a visual report for the end user and stakeholder to help make business decisions. Traditionally, in BI we mostly use a relational database (RDBMS) like Oracle, Microsoft SQL Server, IBM DB2, My SQL and so on. For a reporting tool, we mostly use the IBM Cognos, OBIEE, BO, Tableau or similar.
Today, things are changing very fast. There are many free and open source BI tools that can be used to build the BI system.
MongoDB is a popular, free and open-source NoSQL database. MongoDB stores data in flexible, JSON-like documents, meaning fields can vary from document to document and data structure can be changed over time. Furthermore, The MongoDB NoSQL database can underpin many Big Data systems, not only as a real-time, operational data store but in offline capacities as well.
The BI tool Pentaho prepares and blends data and includes a spectrum of tools to easily analyze, visualize, explore, report and predict. Open, embeddable and extensible, Pentaho is architected to ensure that each member of your team — from developers to business users — can easily translate data into value.
 Pc1 Pentaho functionality
Pentaho and MongoDB have announced advanced MongoDB integration with the Pentaho Business Analytics 5.0 platform, which launched Sept. 12. Together, these technologies provide an interactive analytical solution that meets the increasing requirements for big data in businesses today.
With Pentaho, MongoDB data can be accessed, blended, visualized and reported in combination with any other data source for increased insight and operational analytics. Also, reporting on data stored in MongoDB is simplified, increasing developer productivity with Pentaho’s automatic document sampling, drag-and-drop interface and schema generation.
The following content will show how Pentaho connects to the MongoDB and creates the visualizing reports.
- First, install the MongoDB and Pentaho report designer.
Download the MongoDB install file using the below link and install.

The Future of Big Data
With some guidance, you can craft a data platform that is right for your organization’s needs and gets the most return from your data capital.
https://www.mongodb.com/download-center?jmp=nav#atlas
Follow the below link to configure MongoDB.
https://docs.mongodb.com/manual/tutorial/install-mongodb-on-windows/
If you already have an existing MongoDB, you can get the connection detail.
Download the Pentaho server and Report Designer from the following link:
http://www.pentaho.com/download
- Pentaho runs on the Java platform and doesn’t require an install. Just unzip the file and click the file report-designer.bat to launch the Pentaho report designer.
 Pc2. Pentaho welcome window
- In the above Pentaho welcome window, you can click the “report wizard” to follow the steps to create the Pentaho report or choose the “new report” to create a customization report. “Samples” lists some report samples for your reference.
- Click the “New report” and then right-click the “Data Sets” and choose MongoDB. This will create the data source link for the report.
 Pc3.Pentaho Data source window
- Click the “+” from the right corner. It will open below the create data source window. Choose “MongoDB”.
 Pc4.Pentaho MongoDB data source configuration window
- Click the “+” to add a new query. In the configure connection tab, input the Host name, port, Auth database, user and password.
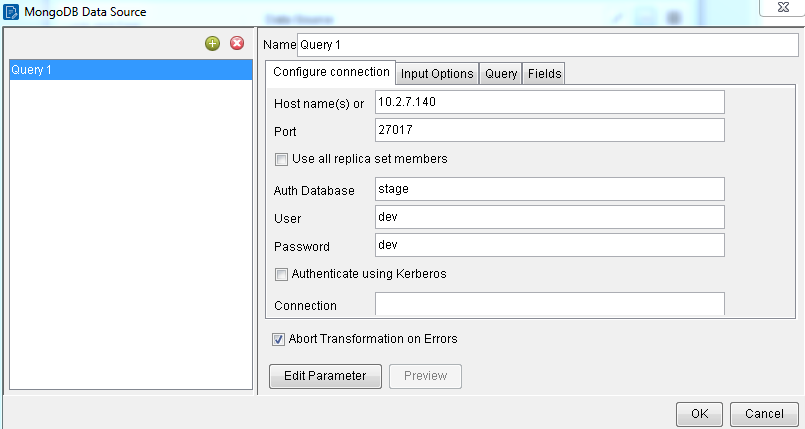 Pc5. Pentaho configure connection
- Go to the Input Options tab. Click “Get DBs” and select the Database. Click “Get collection”. After that, choose the MongoDB’s collection used in the report.
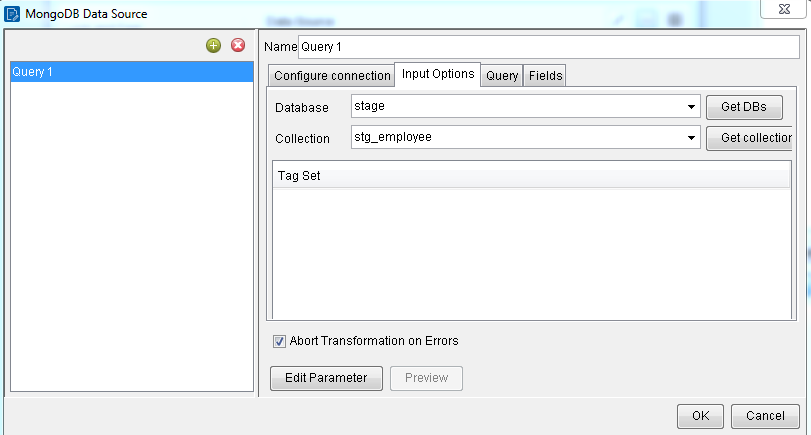 Pc6. Get the MongoDB collection
- Go to the Fields tab directly and click “Get fields”. Finally, all the fields of MongoDB’s collection can be used in the report after you click the OK button.
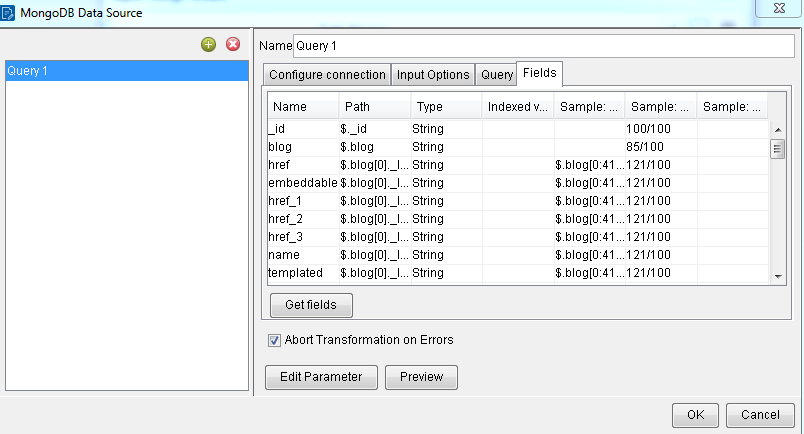 Pc7. Get the fields of collection
- After the MongoDB’s connection is created, you can start working on the report design. To the left of the Pentaho window, you can see all of the report’s components. In the upper right, you can see the source data fields that can be used in the report. On the bottom right, you can see the selected component’s attributes.
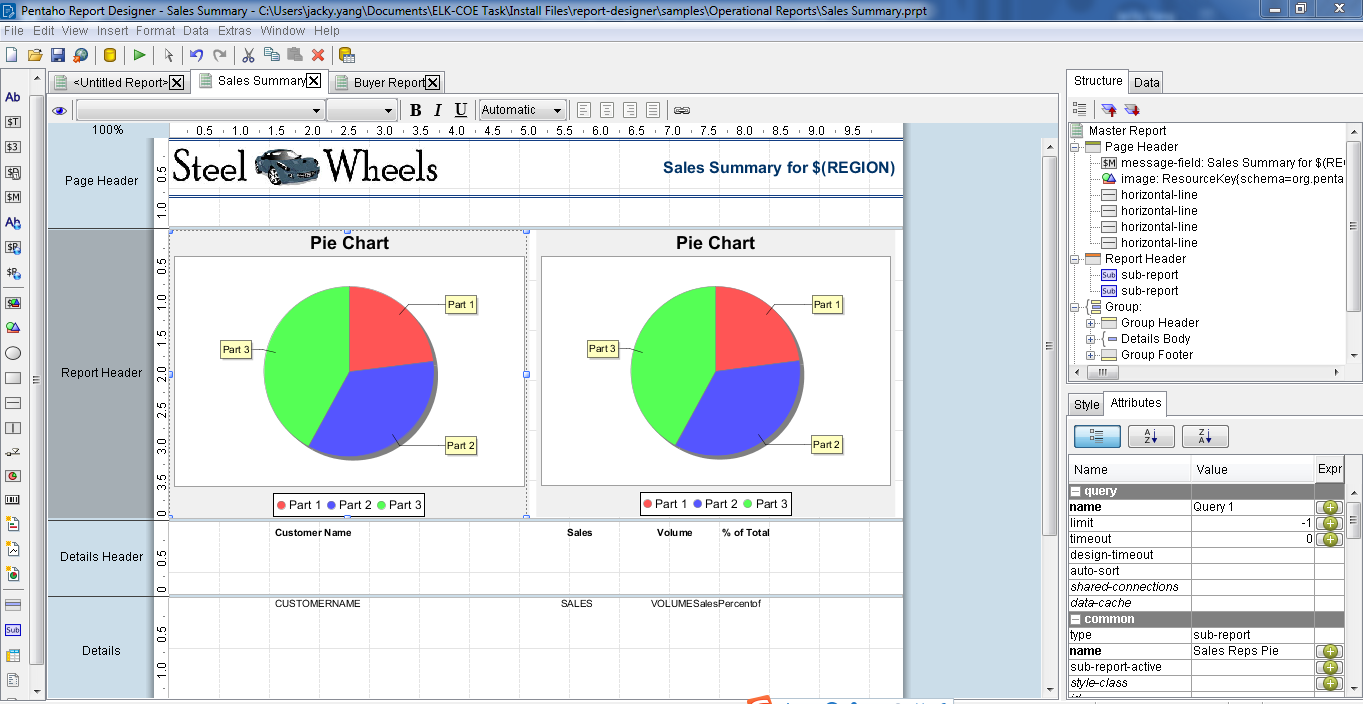 Pc8. Pentaho report design window
You can design any type of report such as a list, chart, bar report etc. This blog just gives you a general idea of how Pentaho connects to MongoDB to create the report. If you want to know more, please visit the Pentaho official website.