While attending one of the hands-on session labs at Adobe Summit 2017, I came across an interesting tool: the AEM Chrome Plug-in. Add the plug-in to your Chrome browser and configure it. When you open the Chrome Developer Tools, it shows as a tab. The UI is very simple and easy to navigate. It as a Tracer tab, which is the most powerful feature of this plugin.
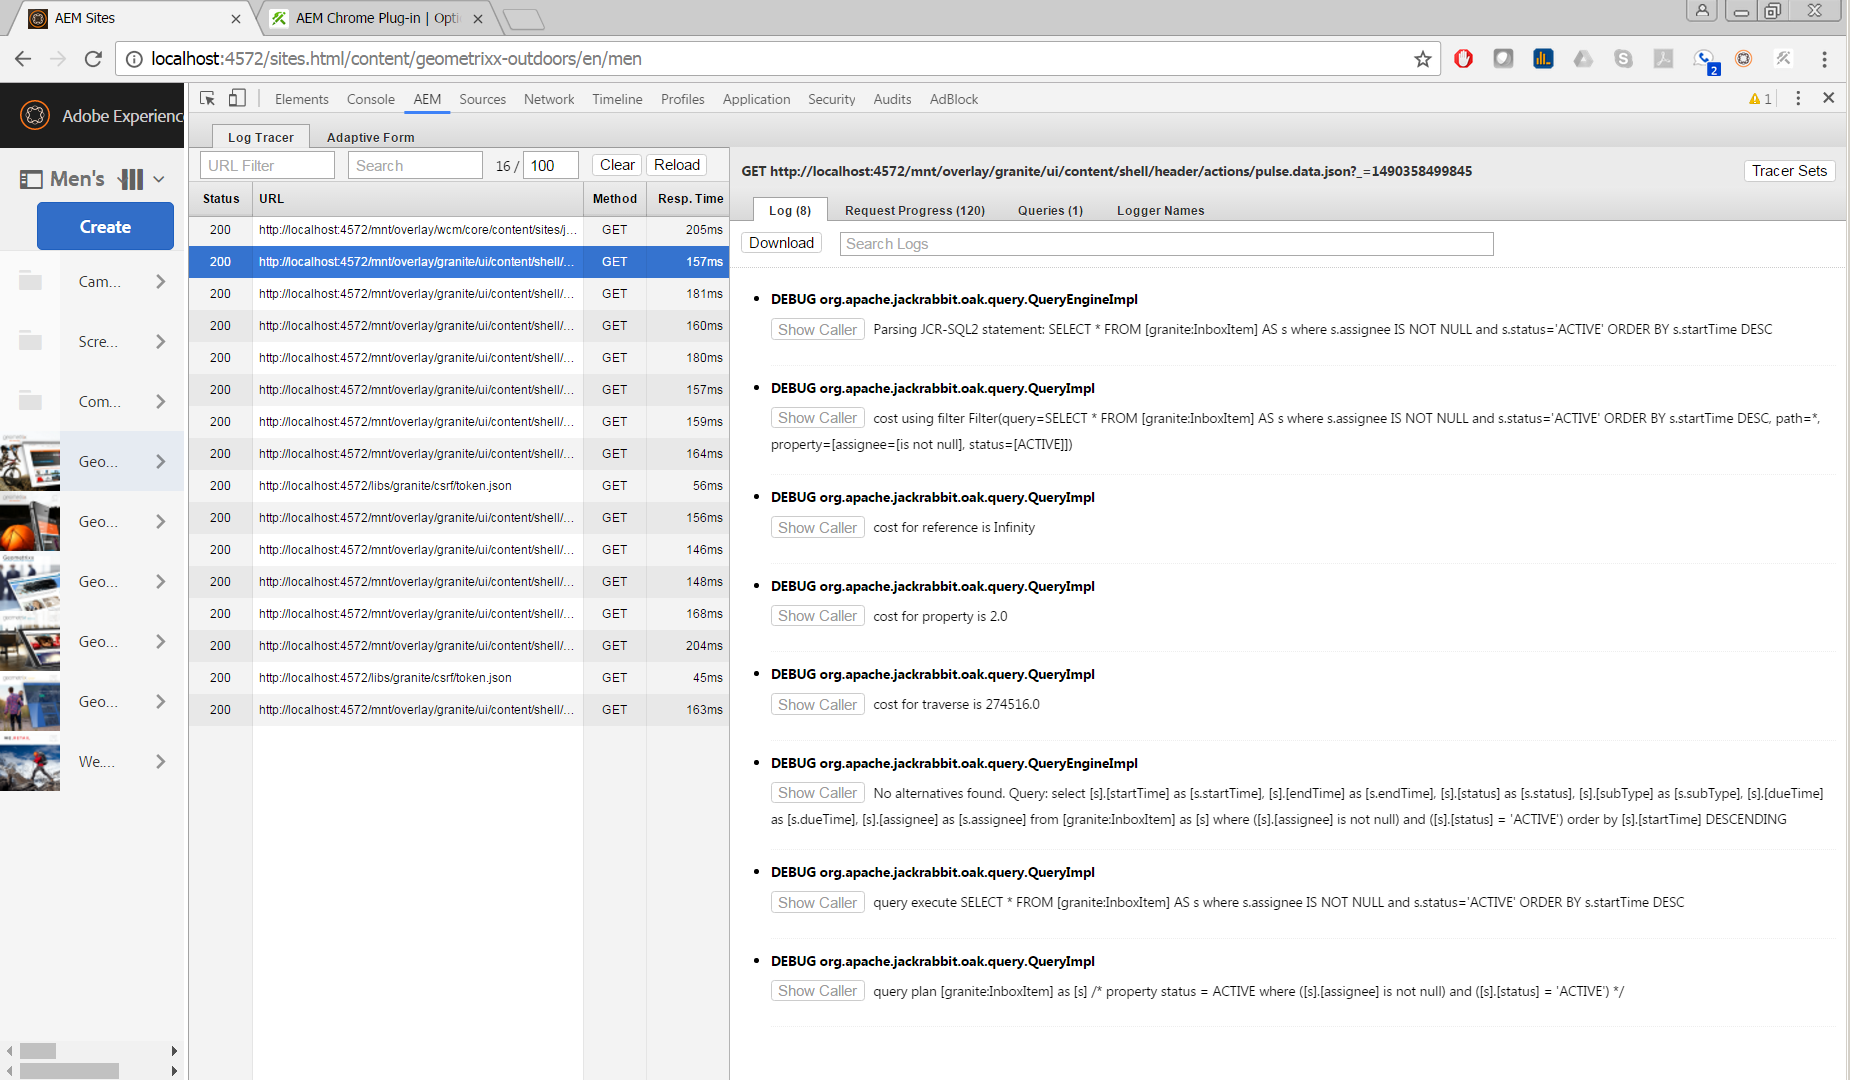
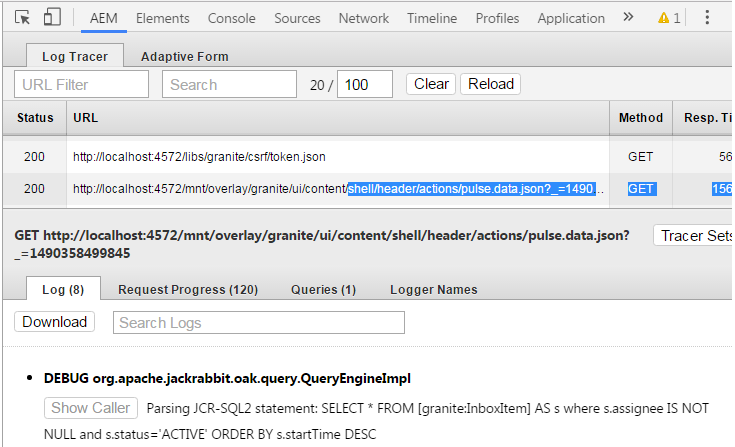
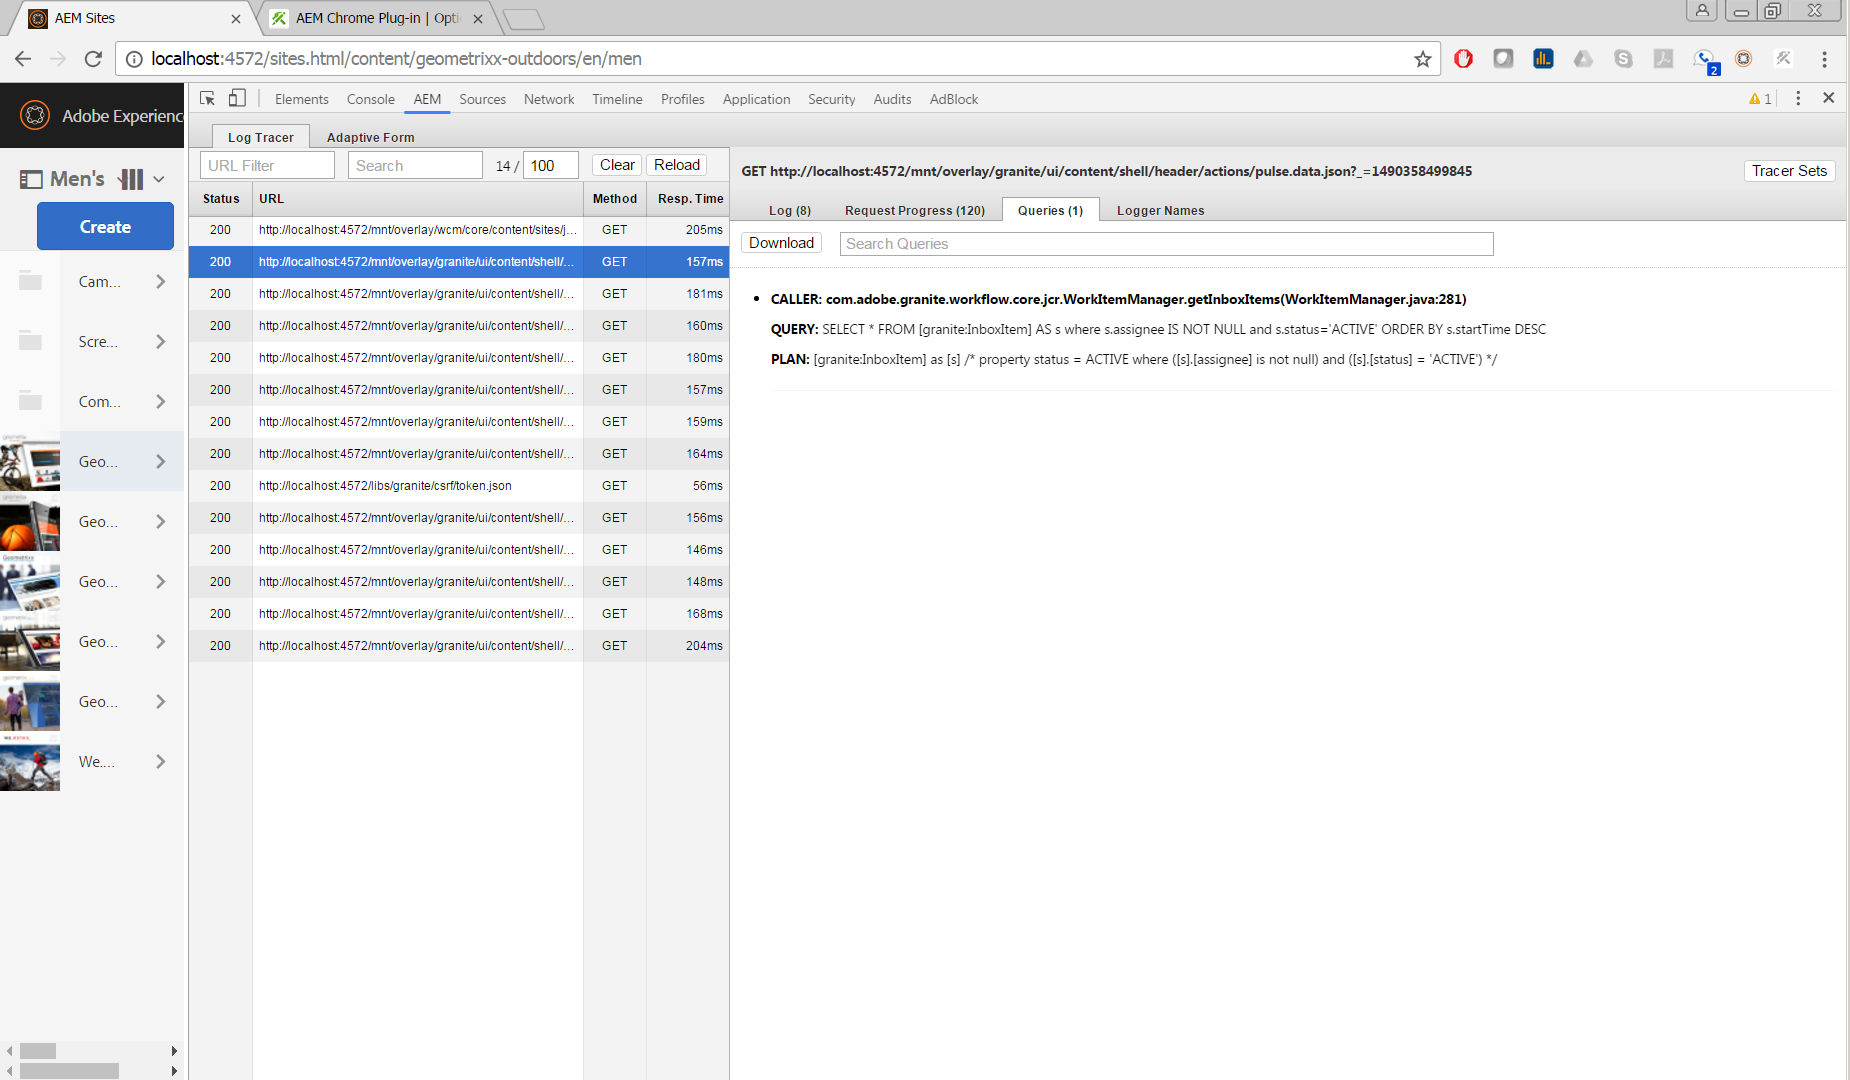
As developers, whenever we see a page performance issue, we always go through tons of logs and trace it either manually or with the help of some external tools. By using this plug-in, the page request and its related logs are visible directly on the Chrome developer tools tab. The Tracer tab shows the in-depth detail of a page request and what queries are executed when the components are processed. See the image below.
This easy-to-use Chrome extension brings a lot of relief to the AEM developer community. It saves time to not have to go through multiple logs for information.