Selenium Tips and Tricks – How to Use Chrome Developer Tools to Help you With the Analysis and Automation of Code
When one is going to get started on an automation project for a web app, one of the most powerful tools that can be used is the Chrome Developer tool. Yet, not many people use it outside of inspecting elements to try and get their locators.
In this blog, I will try to give you some advice and tips on how to use Chrome Developer Tools (abbreviated CDT from now on) to make your work of automating scripts for testing faster and more agile.
How to Open CDT
Let’s start from the beginning. How do I open the CDT or inspect an element on a web page?
Imagine you want to make a script that tests results on searches on the https://www.google.com site. First and foremost, for this task, you will need a way to tell the framework you are using (e.g., Selenium) how to locate the search bar element to interact with it. Luckily, we can use CDT to help us with this task.
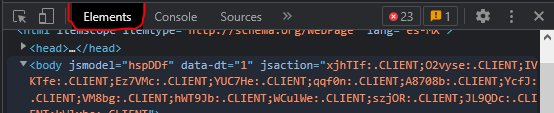
Start the CDT by making right-clicking on the element you want to locate (e.g., Google’s search bar); Next, press the inspect element option.
Now, the CDT is open and should look something like this:
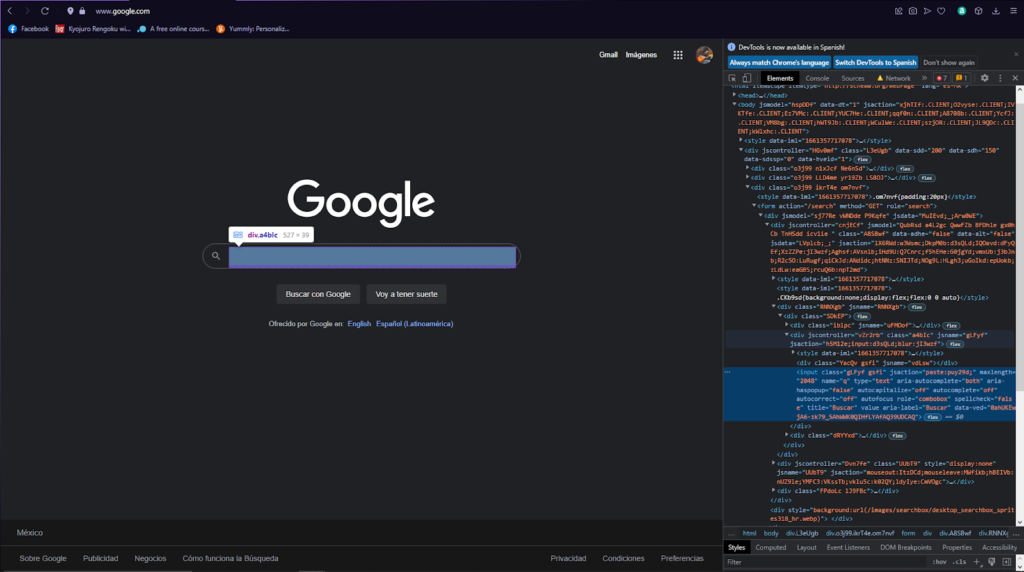
The right panel now shows the whole HTML code for the main google page.
The first thing to observe in the image above is that a part of the HTML code is highlighted; this part refers to the element we were looking for that you can also see highlighted on the page.
From the highlighted object, we can check many ways to locate our element, such as if it has a unique name, a title, or element type (input type in this case).
Element Search Bar or Element Finder
The element search bar can be accessed by pressing Ctrl+F on the keyboard while the Element tab is selected on the CDT.

The element finder will show at the bottom of the Elements tab and will look like this:
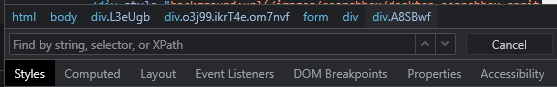
As you can see, the bar suggests the methods by which we can find an element on the HTML doc by string, selector, or by Xpath. So if we know any of these 3 locators of an element, we can verify or check if it’s present on the page/document, but also, the Element Finder bar it’s a practical way to verify if an Xpath we created is a valid one.
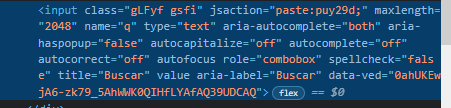
An example of this using the Search bar on Google will look like this:
xpath created by us: //input[@title = ‘Buscar’]
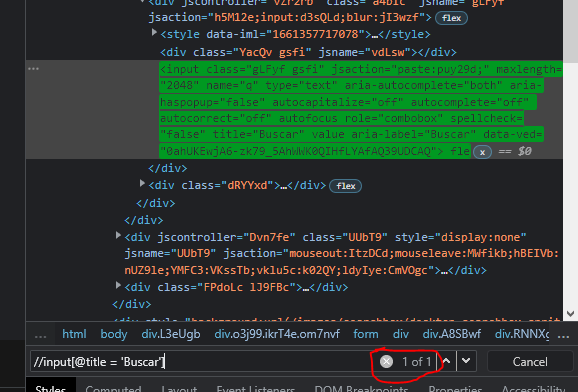
The Element search bar highlights the object that coincides with the Xpath we provided and also tells us that there is only ‘1 of 1’ element within the coincidences. Therefore, our element is present and unique in this HTML which is exactly what we would want.
Debug Console setTimeout Command
Many times on web applications, we can find that some elements can’t be inspected by the usual method (right-click element > inspect element). The cause for why these elements can’t be located may vary, but in many cases, it is because the element needs to be active or selected to be visible. Thankfully, CDT has a function in the ‘Console Tab’ that can help us with this.
The setTimeout command on CDT can help us to force a pause on a Web application or Web page after any event happens (e.g., after a click on any element), making the page stop loading or de-loading any object after an action takes place.
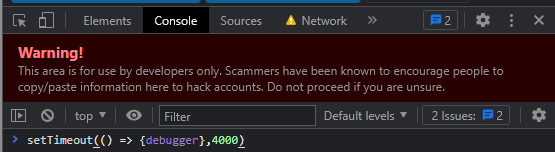
To use the setTimeout command just go to the console tab and type the command setTimeout(() => {debugger}, 4000). Then, enter the command and do the action you need before the page stops loading and gets paused (e.g., click on a dropdown element):
After the command has entered into action (after the execution of our last action on the page), we will be able to see a sign that says ‘Paused in debugger,’ and our current page will still be frozen while this sign is showing.
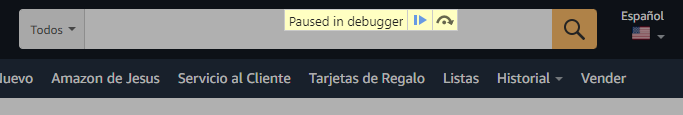
Now we can inspect by right-clicking on any element of the page that is visible or by using the Elements tab finder on CDT. To exit debugger mode, just click on the Play icon in the Paused in debugger sign/alert.
In Conclusion
The purpose of this blog is to help provide tools that help anyone that wants to or is currently in the world of testing automation. I will try to continue adding more tips and tools about CDT or some Chrome extensions that can help make our work automating scripts easier and more efficient.
You can refer to this URL for some other tips and tricks using CDT: