
Dear Reader, here we will discuss about data blending and other appropriate information.
In order to learn the power of data, we need to visualize different types of data in a single pane. This can help businesses come up with actionable points in the finding of materials, sales, product design, supply chain management, and more.
To achieve this objective, one needs to have the ability to visualize data in a meaningful way. This can be done with a data analytic platform with a powerful data blending feature in Tableau. Data blending allows business analysts to cope with the expansion of data needed to make critical business decisions based on good quality business intelligence.
What is Tableau?
Tableau is a powerful and fastest-growing data visualization tool used in the Business Intelligence Industry. It helps in simplifying raw data in a very easily understandable format. Tableau helps create data that can be understood by professionals at any level in an organization Tableau is the fastly growing and powerful data visualization tool. Tableau is a business intelligence tool that helps us analyze the raw data in a visual manner; it may be a graph, report, etc. Data analysis is very fast with Tableau, and the visualizations created are in the form of worksheets and dashboards. Any professional can understand the data created using Tableau. Data Blending in Tableau is so easy that even a non-technical user can create a customized dashboard. We just need to do some simple drag-and-drop operations. We do not need any database or programming experience to use the blending feature of Tableau.
What is Data Blending in Tableau?
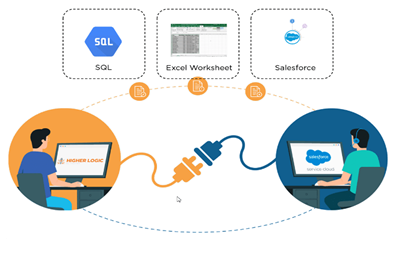
Data Blending in Tableau is an approach to combining data from multiple varieties of sources and displaying them as a whole on one single screen. For example, consider a scenario where a business analyst needs to work with sales data. Now, let us imagine the customer data is stored in the Oracle Database, and the order details are stored in a SQL Server.
The procedure of Data Blending comes in convenient. Business analysts can combine the data from Oracle Database and SQL Server, treat it as a complete, and extract business understandings.
Let us understand Data Blending in Tableau step by step.
Example of Data Blending in Tableau
In the following example, consider two different datasets, namely.
- Sample super store
- Fact table coffee chain
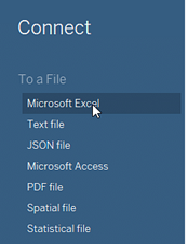
Select “Microsoft Excel” from the Connect Pane.
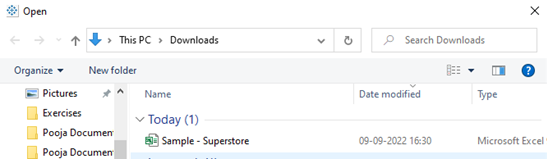
Browse to the Path where the file is present and select it.
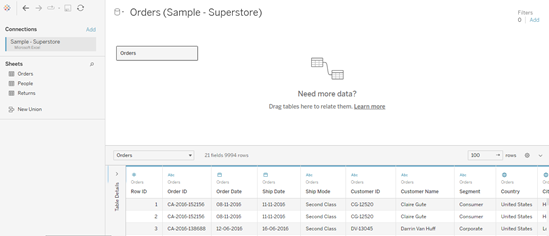
Use the ‘Orders’ table from the Superstore connection. Here is the preview of the data on the Data Grid.

The Future of Big Data
With some guidance, you can craft a data platform that is right for your organization’s needs and gets the most return from your data capital.
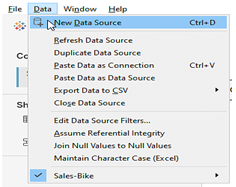
Next, we need to add the data option from the toolbar and import the second dataset. The second dataset is selected now.
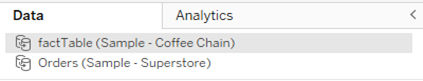
Now, both datasets are visible on the tableau window.
Join the Data from – Fact Table, Location Table, and Product Table
Next, Tableau automatically generates the blend between the data, as shown below.
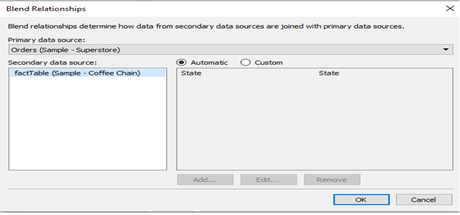
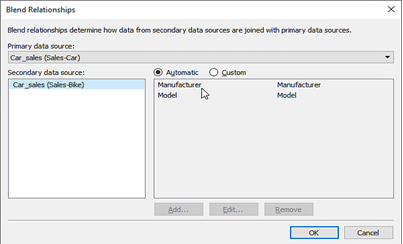
Also, the option of choosing the custom blend is available, as well. The two datasets have similarities between the state columns. So, here you must perform the Custom Data Blending between the two columns as shown below.
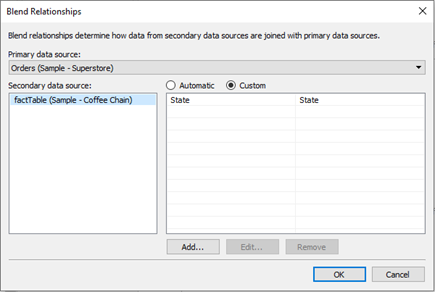
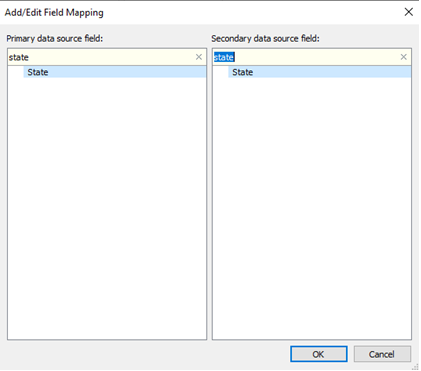
Selecting the Custom option will open a new window. This new window will provide you with columns from both datasets. Next, you must select the common columns and apply the Custom Blend, as shown below.
The next step is to create some visualizations using the data available.
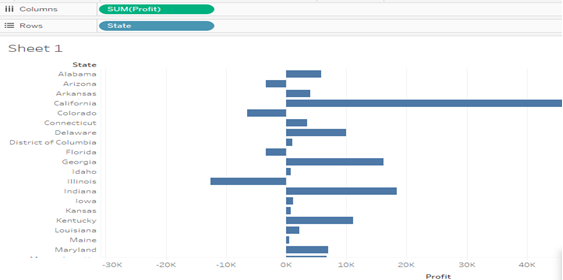
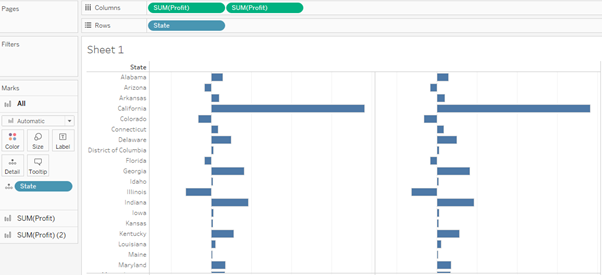
The below chart shows the profits across different States in Superstore.
We can blend the data from the sources based on the shared field. A small chain image would appear next to the dimension called State. This is the common field that Tableau identifies based on the “Names” of the dimensions in both data sources. Now, drag the State field to the rows and the field Profit to the Columns. The secondary data source brings Profit to the Columns. The chart will show how the determinant criterion, such as Profit, varies for each State in both the data sources.
Notice the Orange Link on the “State” dimension in the Coffee Chain data source.
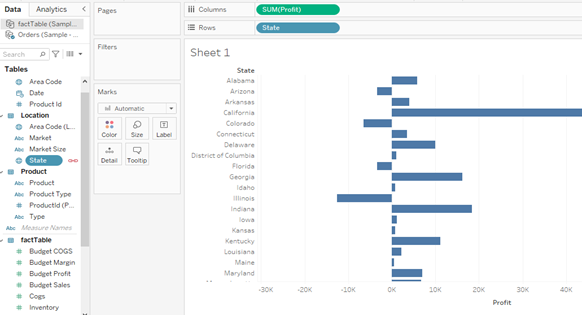
Get “Profit” from the Coffee Chain data source and place it on the Rows shelf. We can see the chart updated with the profits from Coffee Chain as well.
Cross-Database Join Versus Data Blending
To perform data blending, we need multiple and distinct sources of data listed independently, unlike a join. The primary data source and the secondary data source should be distinct and should come from different databases. We need to add the secondary data source to the primary data source.
If instead of adding the secondary data source, we establish another connection to the first database, it becomes a cross-database join. The essential information source and the optional information source ought to be particular and should come from various data sets. On the off chance that, as opposed to adding the optional information source, you build up another association with the main data set, it turns into a cross-data set join.
Limitations Of Data Blending In Tableau
Data blending can be performed between the fields of a single primary data source and those of multiple data sources. The first database used is the primary data source, and this defines the view in Tableau. Owing to this, only those fields in the secondary data source which bear corresponding matches with the primary data source appear in the visualization pane.
This can restrict many values from the secondary data source. This is one of the disadvantages of data blending in Tableau. Moreover, blending is a kind of left join, not exactly a join. We cannot do data source blending in tableau. If we are looking for types of data blending in Tableau, we should know that there is only one type. we can join the two data sources based only on the common dimension/dimensions, whatever those might be.
Good Information!!