
SQL Server Reporting Services (SSRS) is a SQL Server subsystem that enables the creation of graphical, Mobile and printed reports using SQL Server and other data sources. It is part of Microsoft SQL Server Services suite. SQL Server is a relational database management system (RDBMS) that supports transaction processing, business intelligence and analytics applications. It produces formatted reports with the tables of data, graph, and reports. Reports are hosted on a server and can be configured to run using parameters supplied by users.
Here, are prime reasons for using SSRS tool:
1.SSRS is an enhanced tool compared to Crystal Reports
2.Faster processing of reports on both relational and multidimensional data
3.Allows better and more accurate Decision-making mechanism for the users
4.It provides a World Wide Web-based connection for deploying reports. Hence, reports can be accessed over the internet
5.SSRS allows reports to be exported in different formats. You can deliver SSRS reports using emails
6.SSRS provides a host of security features, which helps you to control, who can access which report
How SSRS Works?
The report users are the peoples who work with the data as well as want some insights from data. They send a request to the SSRS server.
SSRS server finds the metadata of the report and sends a request for data to the data sources.
Data returned by the data source is merged with the report definition into a report.
When the report is generated, it is returned to the client.
As we know now what SSRS, Let’s see how to use SSRS to create a Reports –
Step1 –
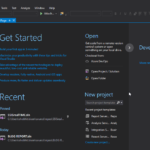
First we open “Visual Studio(SSDT) and click on “Create new project “.
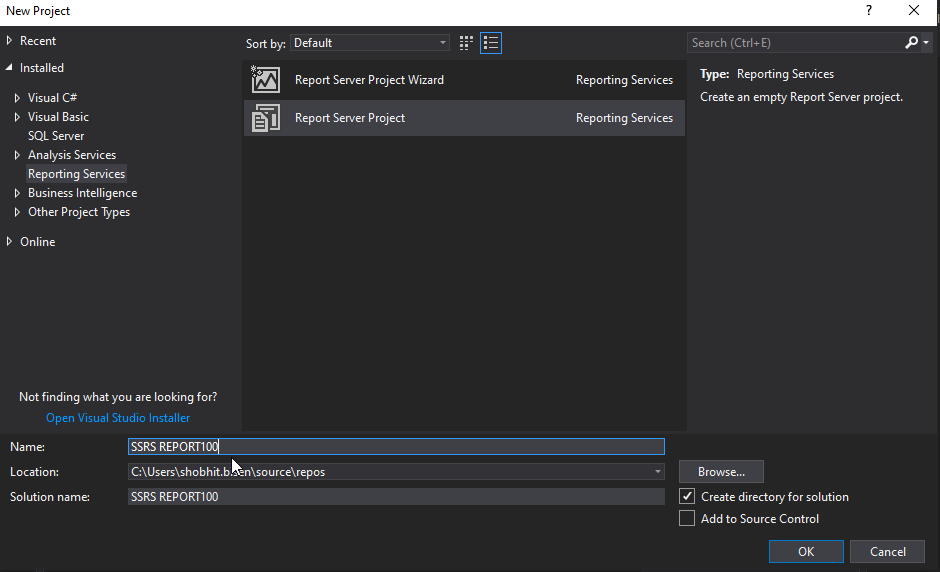
Step2 –
Select Reporting Services and create Report project name.
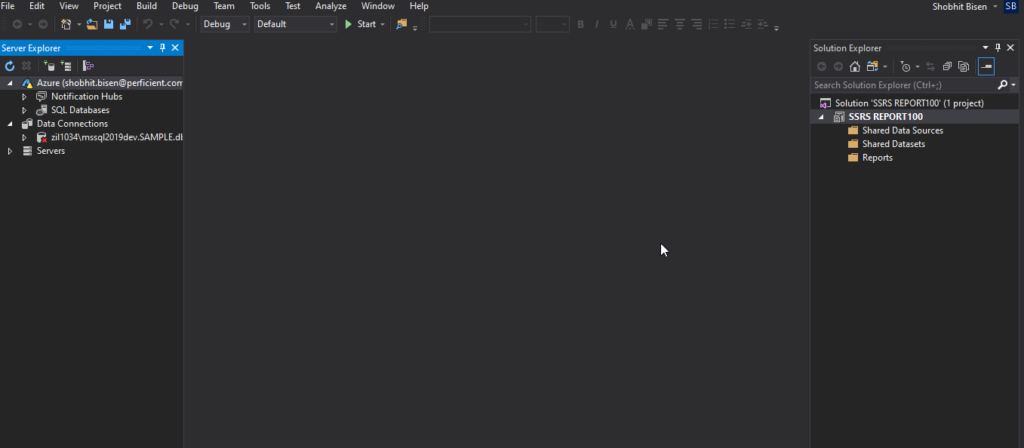
Step3 –
This is the home page of SSRS
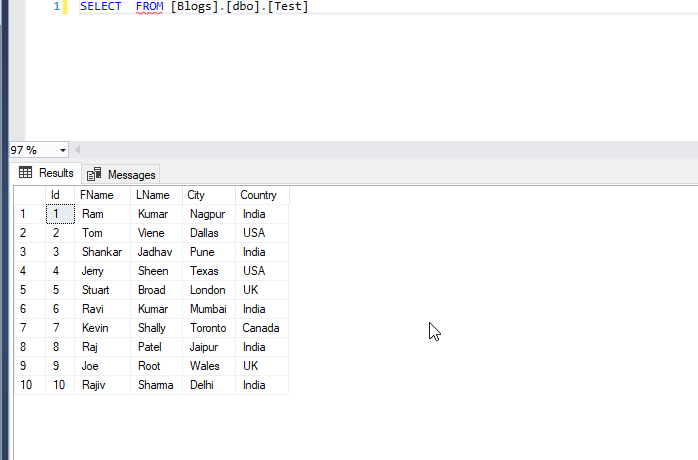
Step 4 –
Now we check our dataset in SQL server for that we have to create a report.
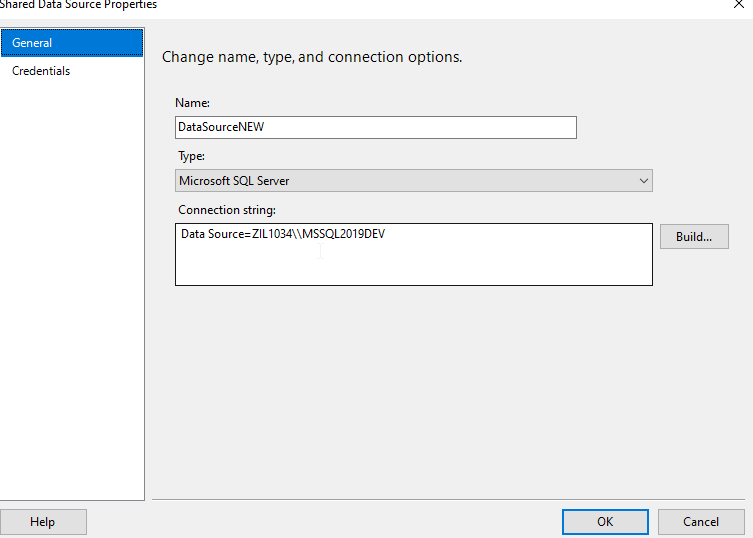
Step 5 –

Now we Right click on shared data sources. First we create data source name and select type Microsoft SQL Server and in the connection string connect with your local server name .
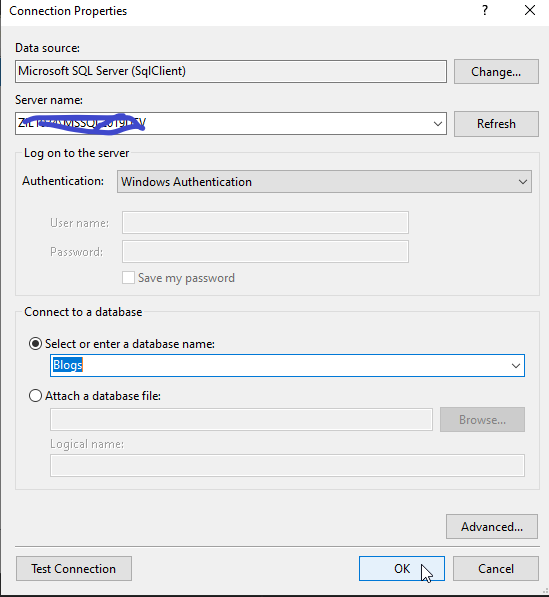
Step 6 –
Now we Right click on shared data sources and select add data sources . First we create data source name and select type Microsoft SQL Server and in the connection string connect with your local server name and select database name of your dataset(table).
Step 7 –
Now we Right click on shared data sets. First we create data set name and select data source that we already created and in the query type select text and write a select statement for the table.

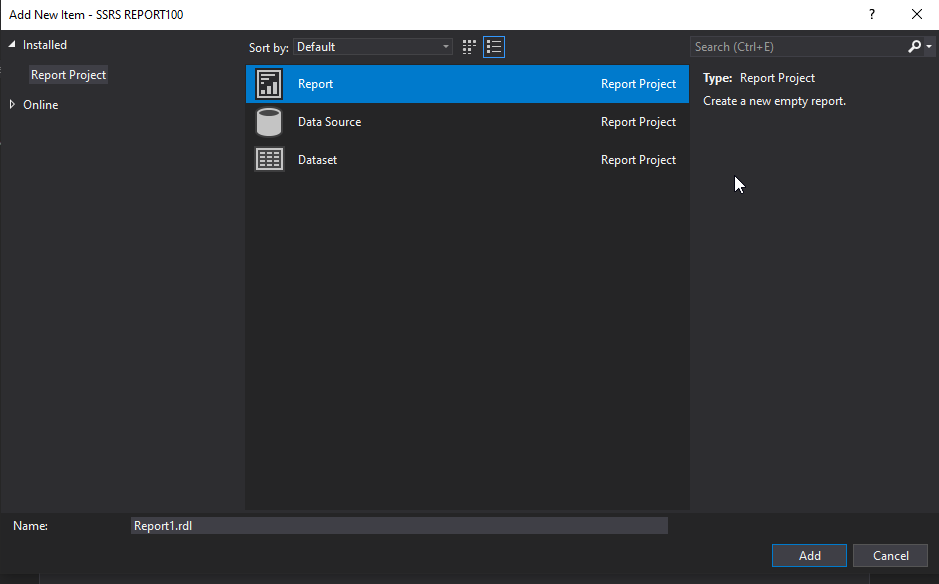
Step 8 –
Now we Right click on Reports and select add then new item.
And new window is open, select Report and it will take to design page of reports.
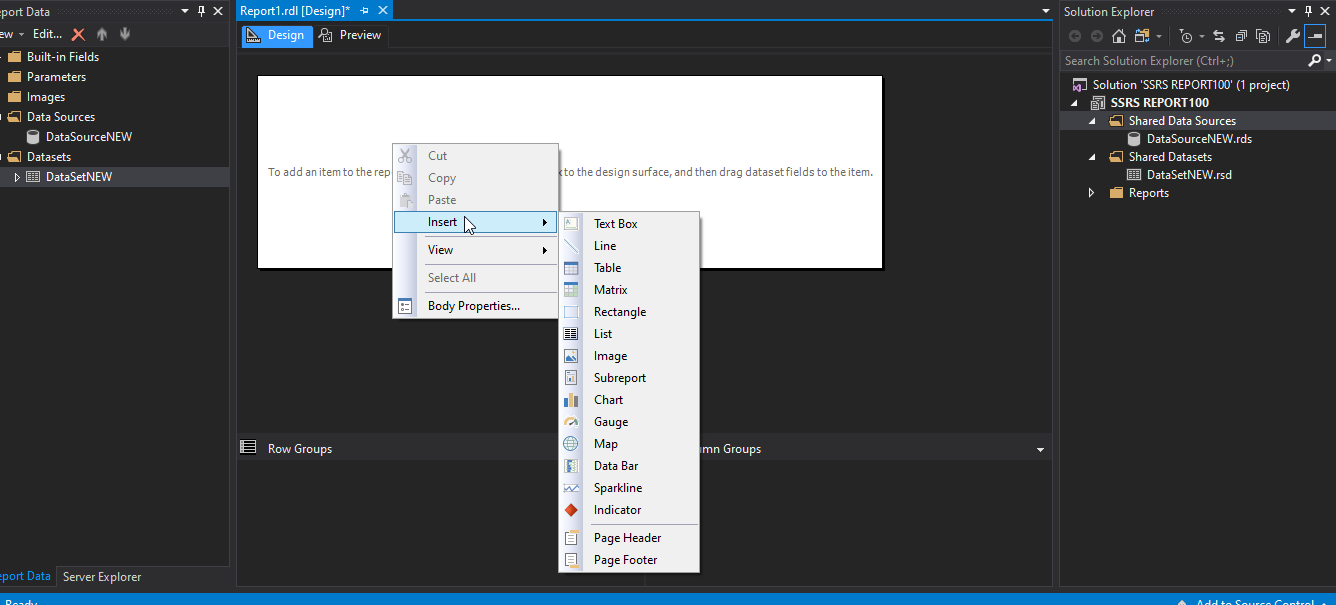
Step 9 –
Now we Right click on design page then insert and click on any required reporting type, in our case we are using chart.
Step 10 –
Now chart type window is open and we can select any required chart type. In our case we are using under shape category.
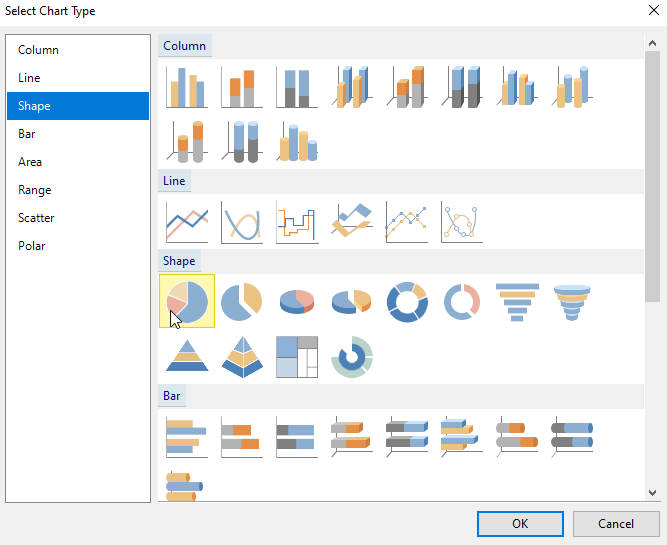
Step 11 –
Now select shape and it will come in our design window.
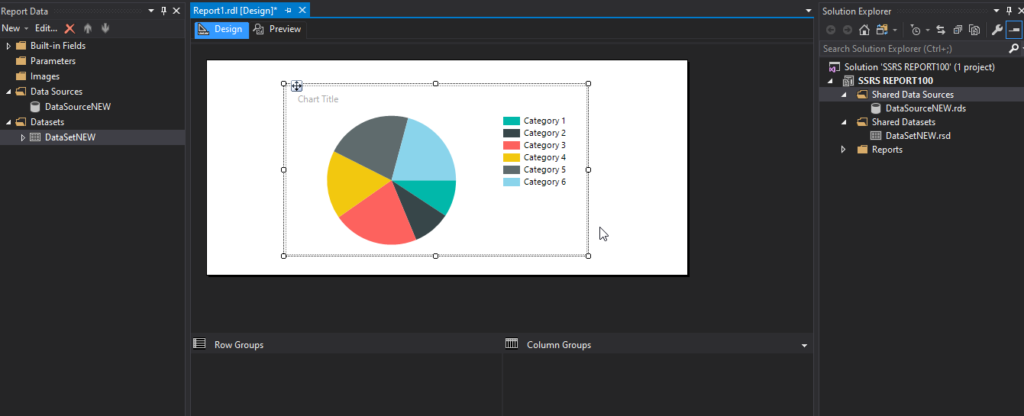
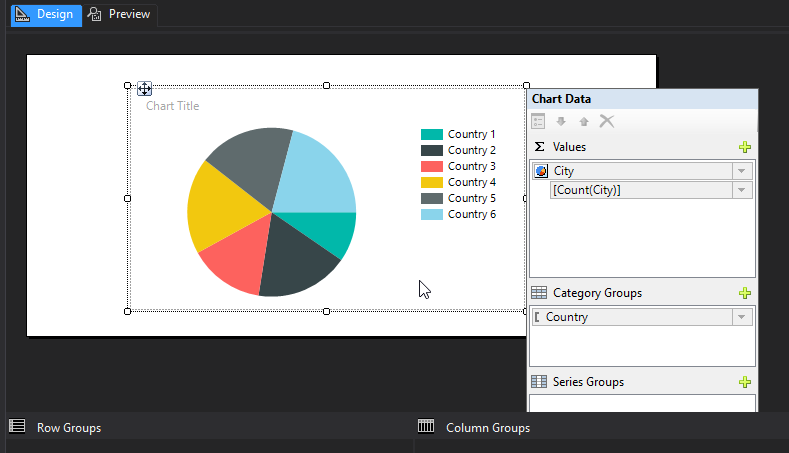
Step 12 –
Now we right click on chart and new popup window will come and we can
Add columns on our report requirements.
Step 13 –
After selecting proper columns for report we can preview our Report in a preview page and now we can send this report.
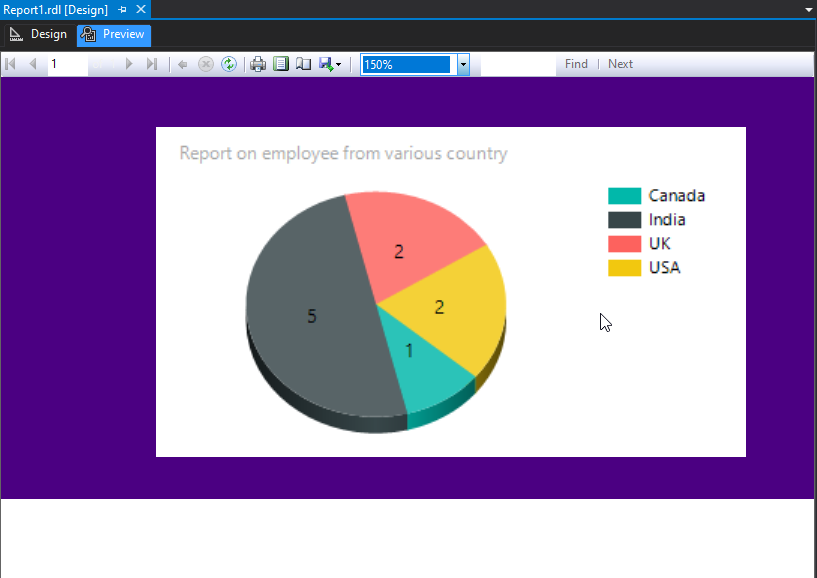
Here we have successfully generated Report using SSRS.
Please share your thoughts and suggestions in the space below, and I’ll do my best to respond to all of them as time allows.
for more such blogs click here
Happy Reading!
Great Blog Shobhit.
Very informative.
Great information shared
Very well explained
Nicely explained Shobit, Bravo!!