
In 2021, If your tableau dashboard takes more than 10 sec to load then you might have some performance issues with the tableau workbook. If you are working with small datasets, you don’t have to worry about the performance. But if you are dealing with millions and billions of records performance can be a huge problem. This will lead you to serious trouble while opening the tableau workbook.
Will see how we can improve the performance at the data source level.
TIP 1: Connection types in the data source
While connecting to data source in tableau we have two options LIVE & EXTRACT. So, using the extract option is reliable and fast in tableau. Because extracts are stored in a very optimized way and store all your results and calculation as a value in the data source. It will calculate once and store the results, hence every time you run the query it will fetch the calculations from data source.
TIP 2: Add data source filters
The more data we have on data sources, the more tableau can use resources in order to do filters, calculations, and aggregations, etc. So, if you have data in data source that you don’t need then you are wasting the resources from the tableau. Also, performance will be impacted. To avoid this kind of situation always remove unnecessary stuff. The best way to remove unnecessary records is by using filters at the extract level
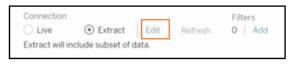
Click on edit and add field name that you want to restrict.

The Future of Big Data
With some guidance, you can craft a data platform that is right for your organization’s needs and gets the most return from your data capital.
TIP 3: Aggregate your Extracts
We can increase the performance of our data sources by reducing the size of it and that’s by using the aggregation functions in data sources. Here, we have two options Aggregation and Roll up.
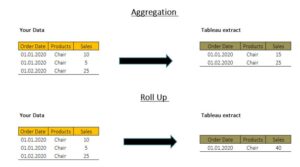
Aggregation: If we use the aggregation at Tableau extracts, It will aggregate those two records into one record for January and sum up the sales.
Roll Up: If we use roll-up function at year level, tableau will aggregate all those three records into one record at the extract and sum up the sales for 2020.
TIP 4: Combine data using Relationships
Let’s say you have multiple tables, and you want to combine them
There are three options:
- Relationships
- Joins
- Data Blending
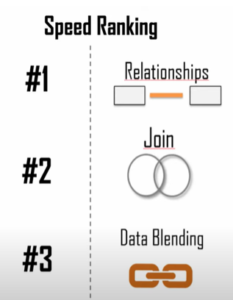
Relationships: You will get the best result because the tableau will leave the table separated and will not merge them in one big table. This will reduce the size of data source. With the relationship, tableau will generate queries only for that data that is relevant for the analytics.
Joins: Joins have a comparatively low performance than Relationships because tableau will execute and combine all the columns from two tables into one big table which might degrade the performance.
Data Blending: If you are blending two large data sources. i.e., SQL and oracle at the lowest level. For example, you are using ID for data blending, and if you want to combine data, go always with the relationships as it gives you the control to optimize the way you want.
TIP 5: Physical Store is Faster
Logical Vs Physical
We can improve the performance if we know how tableau stores the extracts.
We have two options Logical tables and Physical tables.
Always use a physical table if you are not using any filter and aggregation at the data source level. Because It stores data using one extract table for each physical table in the data source. Also, joins are performed at query time which leads to better performance.