
To misquote the great poet Alfred Lord Tennyson, “In the spring a young banker’s fancy lightly turns to thoughts of SNC Classifications.” SNC (pronounced like the candy bar but without the “ers”) stands for the Shared National Credit Program, which, since 1977, has assessed risk in the largest and most complex credits shared by multiple regulated financial institutions.
Governed by an interagency agreement among the Federal Reserve, the Federal Deposit Insurance Corporation (FDIC), and the Office of the Comptroller of the Currency (OCC), the program review credits with minimum aggregate loan commitments totaling $100 million or more that were shared by three or more regulated financial institutions. As a former bank examiner, standardized loan reviews keep consistent reviews and estimates of Default Risk and Loss Given Default across different examination teams, which helps both regulator and the regulated.
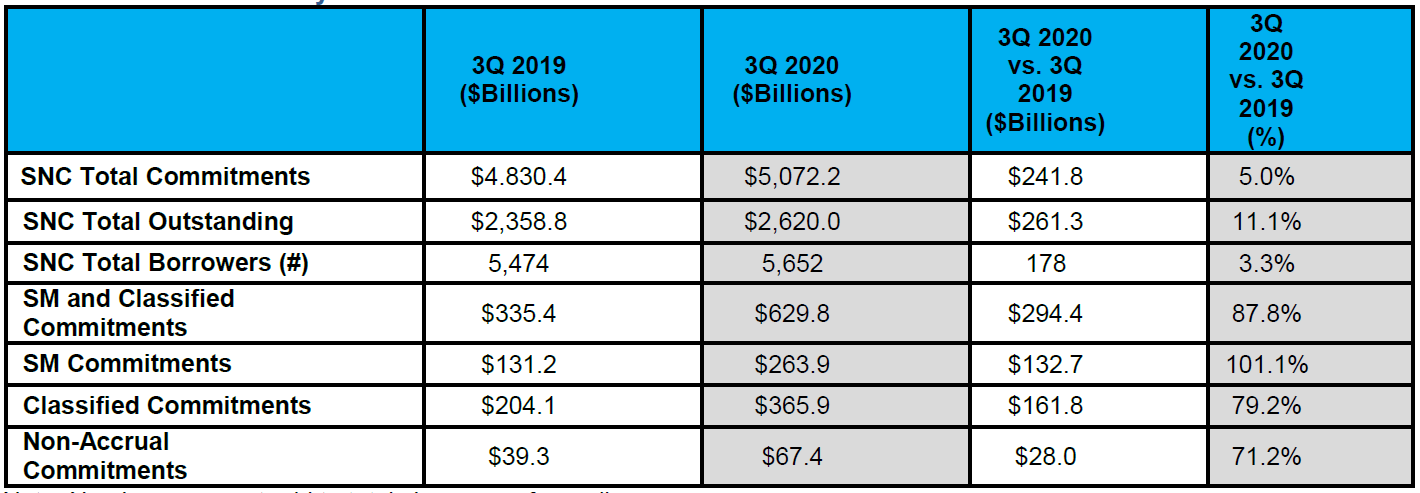
Loan reviews are completed in the first and third calendar quarters each year. Money center banks receive two reviews each year, while most other agent banks receive a single loan review each year. The results discussed in this document are based on loan reviews conducted in the first and third quarters of 2020 and primarily cover loan commitments originated on or before June 30, 2020. As shown in the table below, the reviewed 2020 SNC loans totaled $5.1 trillion in commitments, an increase of $242 billion, or 5 percent, from the third quarter of 2019 to the third quarter of 2020.
While the volume of loans reviewed increased by five percent, the increase in the volume of distressed loans was far sharper, as shown in the graph below:

Note how loans included for Special Mention and classified rose significantly from 6.9 percent in 2019 to 12.4 percent in 2020. The volume of negative reviews was concentrated in transactions that agent banks identified and reported as leveraged loans. The federal banking agencies noted that the increase in non-pass commitments was largely from borrowers in industries heavily affected by COVID-19, such as entertainment and recreation, oil and gas, real estate, retail, and transportation services. Note that while the absolute dollar volume of loans subject to classification and Special Mention neared the 2009 peak, as a result of the larger amount of loans reviewed, the percentage of loans (12.4 percent vs. 22.3 percent) subject to negative review was substantially lower.
While perhaps not as eloquent as Tennyson’s “In Memoriam,” the table below showing historical SNC classifications and criticisms is much more concise for today’s bankers to consume and refer to:
| Committed and Outstanding Balances ($ Billions) | ||||||||
| Year | Special Mention (SM) | Sub Standard (SS) |
Doubtful (D) |
Loss (L) |
Total Classified (SS + D + L) |
Total Criticized (SM + SS + D + L) |
Total Committed | Total Outstanding |
| 2000 | 36.0 | 47.9 | 10.7 | 4.7 | 63.3 | 99.3 | 1,951 | 705 |
| 2001 | 75.4 | 87.0 | 22.5 | 8.0 | 117.5 | 192.8 | 2,049 | 769 |
| 2002 | 79.0 | 112.0 | 26.1 | 19.1 | 157.1 | 236.1 | 1,871 | 692 |
| 2003 | 55.2 | 112.1 | 29.3 | 10.7 | 152.2 | 207.4 | 1,644 | 600 |
| 2004 | 32.8 | 55.1 | 12.5 | 6.4 | 74.0 | 106.8 | 1,545 | 500 |
| 2005 | 25.9 | 44.2 | 5.6 | 2.7 | 52.5 | 78.3 | 1,627 | 522 |
| 2006 | 33.4 | 58.1 | 2.5 | 1.2 | 61.8 | 95.2 | 1,874 | 626 |
| 2007 | 42.5 | 69.6 | 1.2 | 0.8 | 71.6 | 114.1 | 2,275 | 835 |
| 2008 | 210.4 | 154.9 | 5.5 | 2.6 | 163.1 | 373.4 | 2,789 | 1,208 |
| 2009 | 195.3 | 337.1 | 56.4 | 53.3 | 446.8 | 642.1 | 2,881 | 1,563 |
| 2010 | 142.7 | 256.4 | 32.6 | 15.4 | 304.5 | 447.2 | 2,519 | 1,210 |
| 2011 | 106.4 | 190.7 | 14.0 | 9.9 | 214.6 | 321.0 | 2,524 | 1,118 |
| 2012 | 99.3 | 161.7 | 29.5 | 4.6 | 195.8 | 295.1 | 2,792 | 1,243 |
| 2013 | 115.0 | 164.5 | 14.5 | 8.0 | 187.0 | 302.0 | 3,011 | 1,362 |
| 2014 | 149.2 | 171.0 | 11.8 | 7.8 | 191.3 | 340.6 | 3,389 | 1,568 |
| 2015 | 144.2 | 203.2 | 20.6 | 4.6 | 228.4 | 372.6 | 3,909 | 1,867 |
| 2016 | 136.4 | 250.7 | 25.7 | 8.6 | 285.1 | 421.4 | 4,102 | 1,986 |
| 2017 | 131.7 | 245.1 | 24.2 | 16.6 | 285.9 | 417.6 | 4,304 | 2,149 |
| 2018 | 112.4 | 173.9 | 5.1 | 3.4 | 182.5 | 294.9 | 4,435 | 2,106 |
| 2019 | 131.2 | 186.3 | 10.3 | 7.5 | 204.1 | 335.4 | 4,830 | 2,359 |
| 2020 | 263.9 | 314.8 | 30.4 | 20.6 | 365.9 | 629.8 | 5,072 | 2,620 |