All the systems in various domains deal with plenty of data every day. Analysis of this data is essential to perform better and obtain the desired results. This is when Data Science and Analytics come into play. Data Analytics is the interpretation of raw data and its representation in meaningful forms such as graphs and tables.
Valuable insights from raw data are obtained in Excel when they are arranged in tabular columns. These insights are pictured in customizable charts. The modern formula bar helps one perform quick calculations. One can also study data trends on a click. The Office 365 package makes sharing, co-authoring and collaboration of the Excel workbooks easy on the go.
Microsoft Power BI is a powerful Business Analytics tool that can visualize data from multiple sources and transform them into informative insights. Collaboration of files is easy and can be accessed from any platform.
Power BI comprises of Power BI Desktop and Power BI Service.
Power BI Desktop-
- Can connect to a variety of data sources. This data can be up to date with the Auto Refresh option.
- Helps to model one’s data real quick.
- Helps one create interactive reports using the drag and drop canvas.
Power BI Service-
It is a web portal that helps one manage as well as display reports that are created using the Power BI Desktop.
So, why Power BI over Excel?
Data Size and Simplicity-
Power BI can deal with a huge amount of raw data as well as multiple tables of data. The analytical tool has immense capability to load and process a massive amount of data into a single .PBIX file. Multiple tables can be loaded as well as correlated, if needed, based upon common fields. The Power Query Editor as well as the Data Modeling sections are simpler to use in terms of user interface and ease to use.
Data Connectivity and Auto Refresh-
One major reason to prefer Power BI is because it can connect to a wide variety of data sources such as databases, online platforms such as Facebook, Salesforce reports etc. The data is imported immediately into the Power BI Workbook when compared to the time consumed by the ODBC Driver of Excel.
Don’t all of us love to keep our data up to date with its source? Definitely, yes.
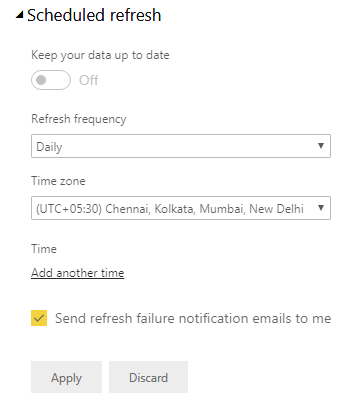
Auto Refresh is one great option in Power BI so that the data remains in sync with the source.
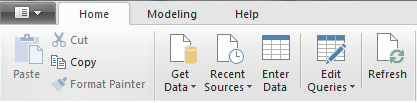
There is a Refresh option in Power BI Desktop and a Refresh Now as well as a Scheduled Refresh option in Power BI Service to keep all the reports updated as well.
When you select Refresh, the data in the file’s model is refreshed with updated data from the original data source. This kind of refresh, entirely from within the Power BI Desktop application itself, is different from Refresh Now or Scheduled Refresh in Power BI,
Whenever you refresh data in a dataset, whether by using Refresh Now or by setting up a refresh schedule, Power BI uses information in the dataset to connect to the data sources defined for it, query for updated data, and then loads the updated data into the dataset.

The Future of Big Data
With some guidance, you can craft a data platform that is right for your organization’s needs and gets the most return from your data capital.
Unlike Excel, the dashboard can be refreshed in Power BI.
Reports and Cross Filtering-
Unlike Excel reports, Power BI reporting is much advanced, interactive and a single graph can provide multiple insights.
Cross filtering is not available in Excel but applicable in Power BI.

This influences how users want the filters to flow for data using relationships between tables.
Alerts and Emails-
In Excel, one needs to create a macro in the VBA Editor to send a mail and a reminder.
Creation of an alert and triggering an email when a condition (Eg. a threshold value) is met, has never been easier in Power BI.

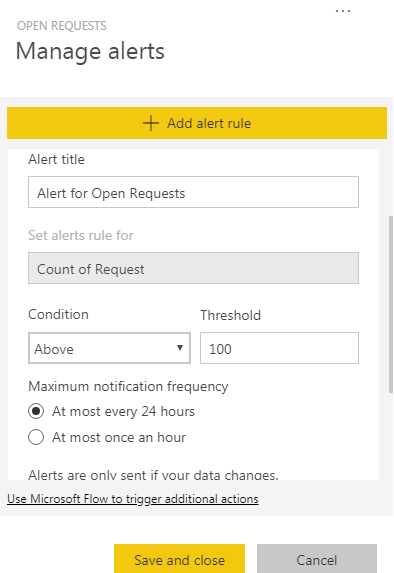
This can keep users alert on the go and they can access the report anytime and anywhere.
Other Bonus Features-
- Natural Language Query
This feature helps anyone get a quick answer from the existing insights by asking a layman question in Power BI Service.
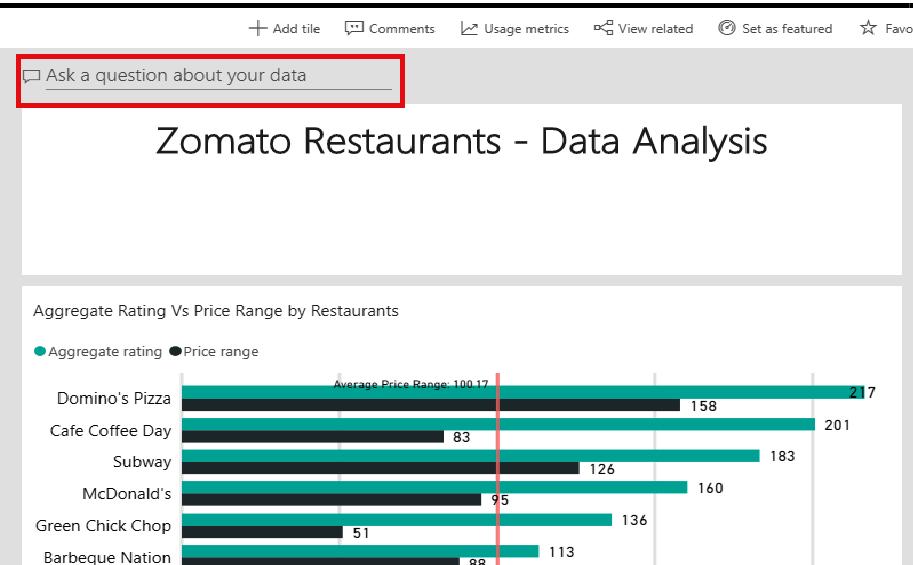
It is useful when someone is not aware of the data model but wants quick answers related to the insights. Further this saves plenty of one’s time.
- Quick Insights
The powerful software run by intelligence and algorithms in the backend can develop interactive insights just on the hit of a button.
It can save time as well as help one to analyse data quickly.
- Customizable Reports and Dashboards
The reports that are developed can be customized any manner to provide the desired results. The report tiles on the dashboard can be altered and moved as per one’s desire.
- Permissions and Sharing of Reports
One has the option to share the reports as well as dashboards to the public or within a group of associates alone.
- Download and Export of Dashboards
Power BI Service supports different formats of the dashboard to download and share with others. One can send the dashboards as a .PBIX file or export them as a PowerPoint presentation, PDF or event print the same.
Conclusion-
Today’s data driven world calls for a quick and efficient data analytics tool. PowerBI makes use of business intelligence and makes sure all the reports are developped quick and provide plenty of insights. Change in time and advancement in technology calls for a powerful tool like Power BI that makes one’s work easier and saves plenty of one’s time, providing the best results.