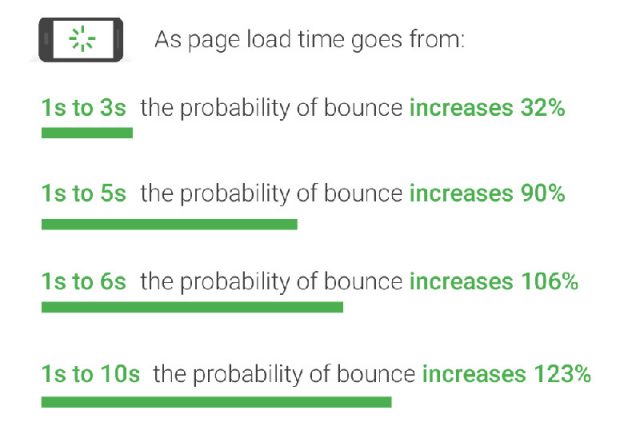
“No matter what, faster is better and less is more.”- Daniel An, Google Global Product Lead, Mobile Web
You heard it here first: 2019 is going to be the year of page speed. Google’s been signalling its goal of accelerating web experiences for years, but in 2019, we think it’s going to get really real for digital marketers.
Delay or ignore needed speed improvements and you’ll frustrate both Google and, more importantly, your hospital’s website visitors. The damage to your organic search visibility, campaign conversion rates, and overall user engagement could slow your plans for the year before you even get started.
In this 2-part article, let’s first take a look at the recently updated tools Google offers marketers to assess how they’re doing and where improvements might exist. We’ll take a look at some of the country’s leading health systems and see how ready they are for 2019. You’ll be surprised since several of them look to be at risk of problems.
Google thinks of the page loading experience the same way that your website visitors do:
- Is it happening? Did the navigation start successfully? Has the server responded?
- Is it useful? Has enough content rendered that users can engage with it?
- Is it usable? Can users interact with the page, or is it still busy loading?
- Is it delightful? Are the interactions smooth and natural, free of lag, and jank?
A few weeks ago, Google introduced the latest version of its popular PageSpeed Insights tool. It’s a goldmine of data, insights, and recommendations. Better, it’s free and easy to use.
Navigate to Google’s tool and try testing a few of your pages. Be careful that you’re testing the “definitive” version of these pages — that is, the one that renders when you actually visit it online. Confusingly, URL variations like ebay.com, http://ebay.com, www.ebay.com, and https://www.ebay.com can all show slightly different results. For eBay, the last variant is the one you’d want to look at.
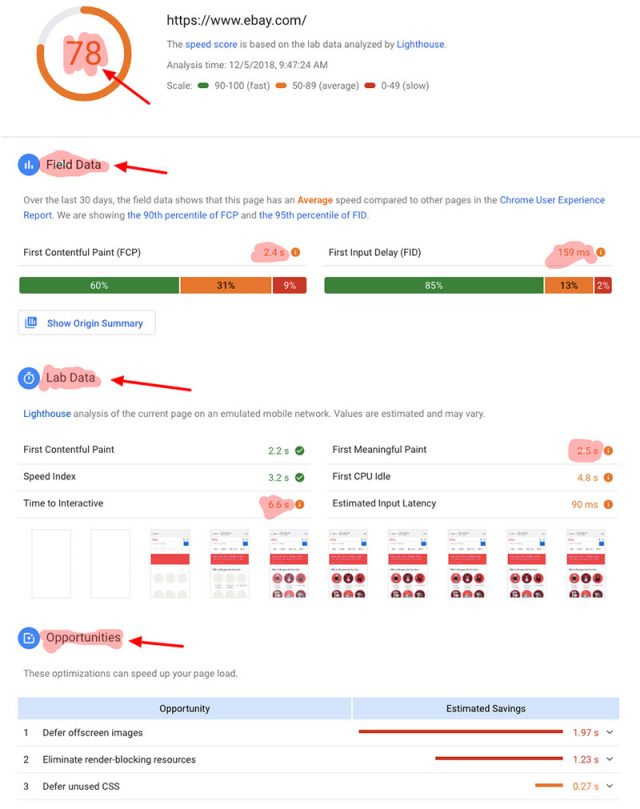
Let’s take a look at a typical results page:
There’s a lot to process here, but, at a high level, first take notice of the separate tabs for “mobile” and “desktop”. Mobile is the default view — a telling sign of where Google wants us all to focus.
Then, like a report card, Google distills your page’s overall performance to a single 1 through 100 numerical scale. A perfect score of 100 is theoretically achievable, but anything above 90 is still considered “fast”. If you score below 50, Google considers your site “slow”.
We think a “slow” page should be a source of concern, not necessarily alarm. Content rich pages with complex functionality are sometimes unavoidably slow. You’re better to be asking why the page is slow, how it compares to comparable competitive pages, and what can reasonably be done to accelerate its load time.
There are 5 main sections after the performance score: (1) field data, (2) lab data, (3) opportunities, (4) diagnostics, and (5) audits. Explore them all, but we’ll focus on the first 3 since that’s where you’ll find the most actionable information.
- Field data displays real-world performance metrics as captured by millions of users of Google’s Chrome browser. Two specific metrics are highlighted: First Contentful Paint (FCP) and First Input Delay (FID).FCP marks the point when the browser first renders content. It provides feedback that the page is actually loading — in other words, that something is happening. FID measures how quickly your site can respond to a first click or button tap.
Google shows your page’s speed but, more usefully, shows how you’ve performed over the last 30 days and how you stack up against what they consider “fast”, “average”, and “slow”. The more green you’re seeing here, the better!
One important caveat here: a well-optimized website can still be scored poorly by Google if its visitors tend to have slow connections or outdated devices. We’ve seen this with rural health systems where Internet connectivity can be slow. - Lab data displays performance metrics based on a simulated network, browser, and device. We won’t explain all the metrics, but encourage you to pay special attention to First Meaningful Paint (FMP) and Time to Interactive (TTI).
FMP measures when the primary content of a page is visible — a video, for instance. This tells users that the page is usable. TTI is more nuanced. It measures how long it takes a page to load and become interactive. - Opportunities are Google’s most important suggestions for improving your page’s performance. Each suggestion — like “Serve images in next-gen formats” or “Properly size images” — estimates how much faster the page will load if the improvement is implemented. Click on the advice and you’ll see very specific examples of what Google thinks you should fix.
What are some of the more common improvement suggestions? From our experience, you’ll likely see at least a few of these:
So, what should you do once you’ve tested some key pages and compared them with a few of your competitors?
- Schedule some time with your website’s technical team. Catch them up on why speed matters more than ever and share what you’ve found with Google’s tools.
- Set goals for your key (home, service lines, find a doctor, campaigns, etc.) pages. They could be speed targets, competitive benchmarks, or even page “weights”.
- Prioritize your efforts. Not everything matters equally and some improvements will be more difficult than others.
- Take on some of the basic work yourself. Optimizing and resizing images on a few pages, for instance, is a job that even an intern can undertake. That said, your technical colleagues will also have to own some of this.
- Measure and keep track. Watch your progress over time, post a visible scoreboard, and hold your team accountable for forward progress.
- Tighten your goal as you succeed. It’s amazing what progress can be made once there’s a focus.
- Consider working with an agency like MedTouch who can augment your technical team’s bandwidth. They can automate your monitoring efforts with management dashboards and build tools like automated image optimizers into your content management system’s publishing workflows.
- Recognize that we’re all chasing a moving target of expectations. Today’s “fast” pages will more than likely be judged “average” in 2-3 years so there’s no room for complacency. Be vigilant for new tools and best practices.
To learn more, we recommend:
- Google Web Fundamentals: Why Performance Matters
https://developers.google.com/web/fundamentals/performance/why-performance-matters - Google State of the Union for Speed Tooling
https://youtu.be/ymxs8OSXiUA - Google Web Fundamentals: How To Think About Speed Tools
https://developers.google.com/web/fundamentals/performance/speed-tools/ - Google PageSpeed Insights technical documentation
https://developers.google.com/speed/docs/insights/v5/about - Google PageSpeed Insights Group
https://groups.google.com/forum/#!forum/pagespeed-insights-discuss
In part 2 of this article, we’ll take a look at how the websites of several top-tier health systems are performing speed-wise. It’ll be eye-opening, we promise!


