Sitecore performance is something I am passionate about. So “Measure, if you want to go faster” was a session I definitely didn’t want to miss at Sitecore Symposium. Here are my takeaways:
Use Tools
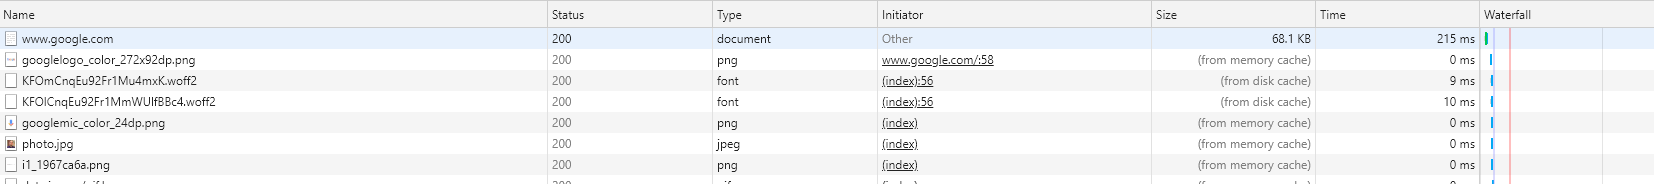
Many developer tools have pretty great performance measuring tools built right in. The first tool Jeremy Davis, the session speaker, suggested for measuring performance is the built-in browser dev tools.
Using Chrome, open the developer tools and go to the network tab. The very top number represents the time to first byte and should be as low as possible. There is no set rule on what the number should be but anything more than 300 ms (after the first request warms Sitecore and caches data) should be investigated.
Another great tool to consider is Sitecore’s built in debug mode. I usually start debug mode from the experience editor like so:
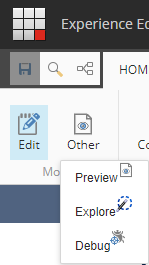

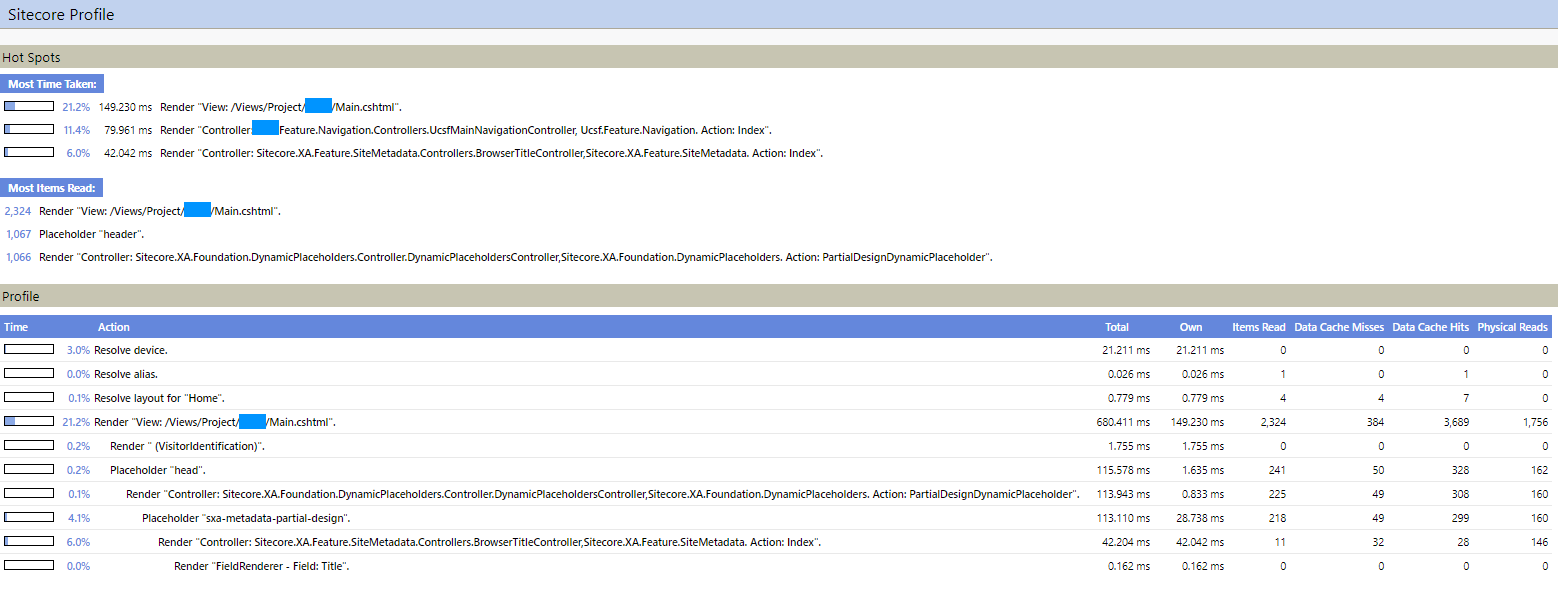
Once in debug mode, a trace output shows up at the bottom of your site with some great performance-related information. The most important information to identify is which components seem to take the longest to render. That doesn’t necessarily indicate a performance problem. However, it may indicate where you should spend your time if you do need to lower overall page load time.
The last tool Jeremy mentioned is the Profiler built into Visual Studio, which is actually quite robust and can pinpoint the line of code that is causing your problem. Analyzing both CPU and memory usage will allow you to see where your performance problems are.
Development Process
Your development process should include checks around performance. Measure regularly and measure early. Absolutely do not wait until the end of a project to analyze and debug performance problems. It will be much easier and faster to analyze and fix those problems as you go.
Also, make sure that when you test, that you use realistic content. For example, if the production content will include 50+ links off of the menu, make sure you test content that has a similar number (maybe your code is fast with 10 links but with 50, some performance issues start to pop up).
Output caching in Sitecore is a great way to improve performance. As a developer, make sure that all renderings you create have output caching enabled if possible. Watch out for components that use complex Sitecore queries or a query that returns a large amount of data. Can you use an index query instead? Can you output cache the rendered result of the query? As a developer, making performance a focus of your work is important. By doing so, the solutions you deliver will be faster, will often scale better and will make your end users happier by delivering the site as fast as possible.
Subscribe below to gain more best practices and tips! For more information about what was presented by Jeremy at Symposium, reference the deck (caution: 140 MB download) he presented.