In this blog, I will be describing how to configure the PowerBI Desktop connection to Hive instantly on Hadoop and visualize Hive data using Microsoft Power BI. The Hive ODBC Driver, along with direct SQL and HiveSQL, is used to access the Apache Hadoop/Hive distributions. This enables the Business Intelligence (BI), analytics and reporting functions for the Hadoop/Hive data. The following shows the simple flow chart to show the relationship between Hive, PowerBI and the report.

Configure PowerBI Desktop to Show Data from Hive
Hiveserver2 allows for a connection via standard ODBC. To do this, you will need to download and install the HiveODBC64.msi on the system.
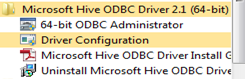
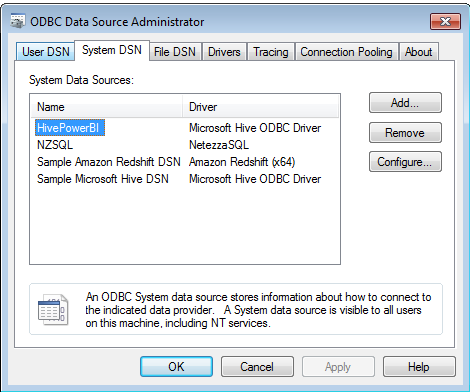
After the driver installs you will need to set up a System DSN. Open up the ODBC Data Source Administrator and click on the System DSN tab.
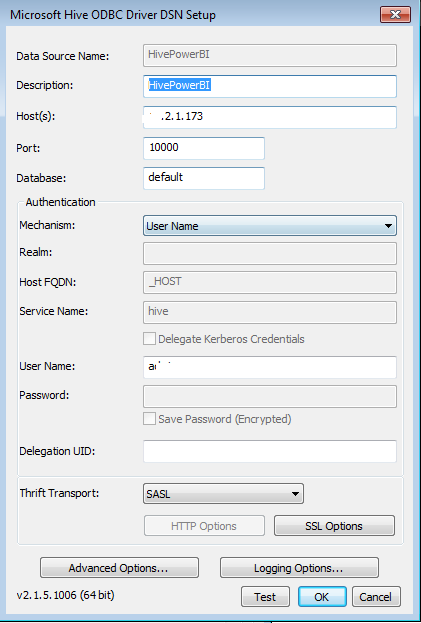
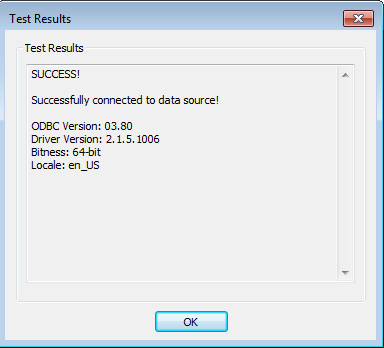
The following screen shows the settings for my DSN:

The Future of Big Data
With some guidance, you can craft a data platform that is right for your organization’s needs and gets the most return from your data capital.
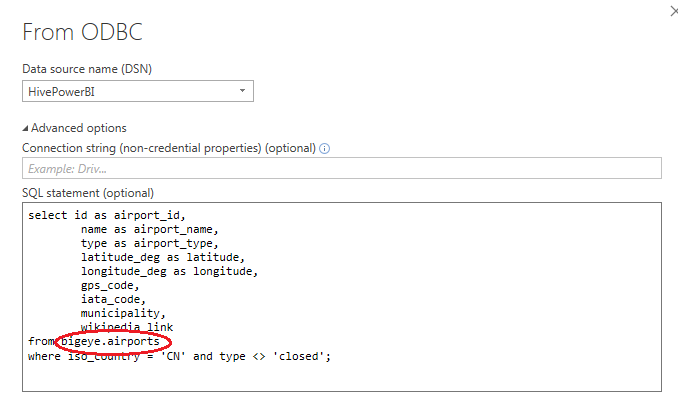
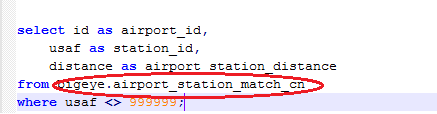
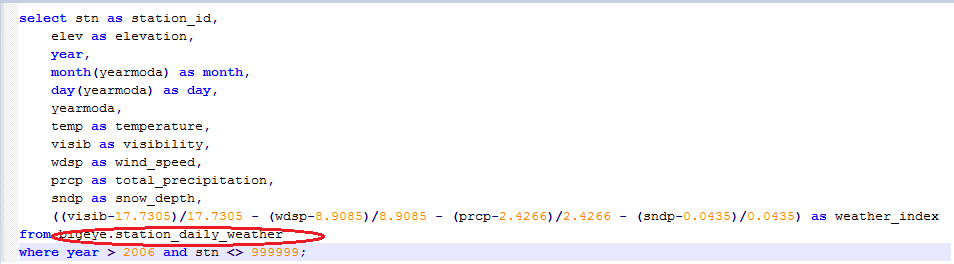
Once successful, you can now open up PowerBI to choose the data source name that was configured previously. We can manually add our own SQL in SQL statement to load the weather data from the data source in PowerBI.
Display Airport data in Power BI
Drag the field airport_name to slice and drop it onto the top of the slicer placeholder. Select the Map option in the Visualization pane. Add airport_name to the Location bucket in the Visualizations options to use a map visual. Then drag longitude to Longitude, drag latitude to Latitude. Save the report. Now the report looks like below in PowerBI
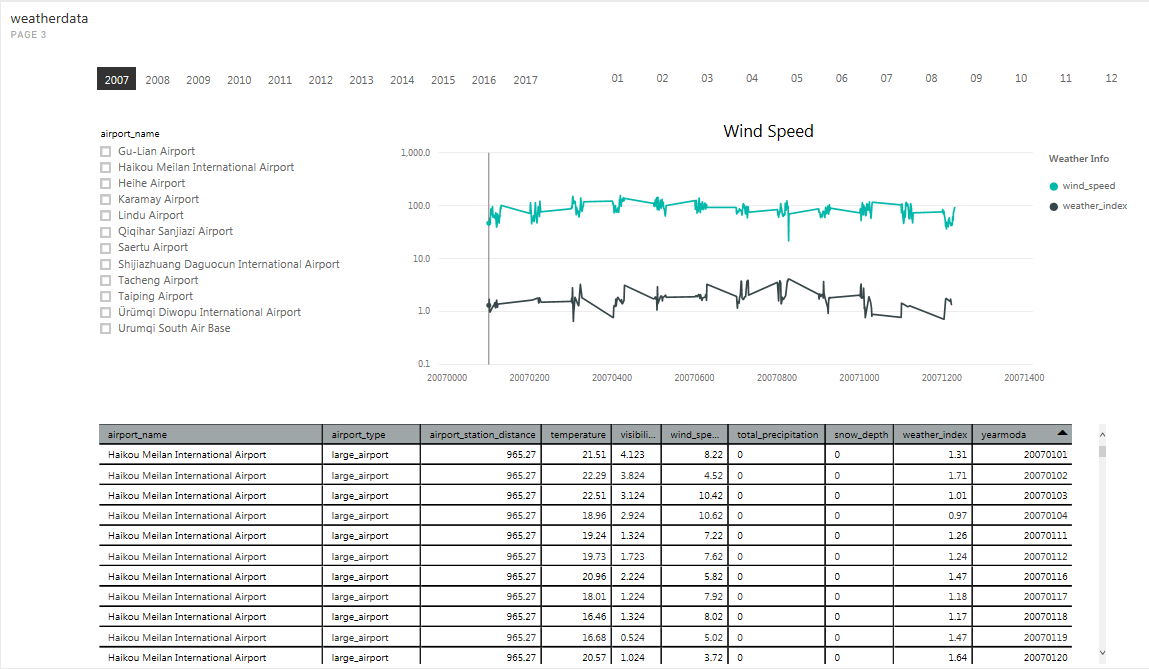
Display Weather Data in PowerBI
Drag the following objects to Slice:
Year
Month
airport_name
select line_chart in the Visualization pane. Add yearmoda to the Axis then drag wind_speed and wind_index to values.
select table in the Visualization pane and add the required columns to the value.
Save the report. The report looks like below in Power BI.