With the evolution of cloud technology, more organizations are planning to move their BI platform to cloud such as Azure or AWS. In Azure, PowerBI is pretty straightforward and popular, and with Power BI Desktop, you can perform analytical and statistical analysis and create compelling visuals by integrating with R. You can host those R visualizations within the Power BI Desktop report.
1.What are R Visuals?
The Power BI service supports viewing and interacting with visuals created with R scripts. Visuals created with R scripts, commonly called R visuals, can present advanced data shaping and analytics such as forecasting, using the rich analytics and visualization power of R. The R programming language is among the most widely used programming languages by statisticians, data scientists, and business analysts. The R language has an open source community that offers over 7,000 add-on packages, as well as widely used R User Groups.
2.Two Steps to Create a Report with R Visuals
Step 1. Get Data
Start the Power BI Desktop. In the Get Data window, select Other -> R script.

In the R script dialog that appears, Enter the R code to get the data.
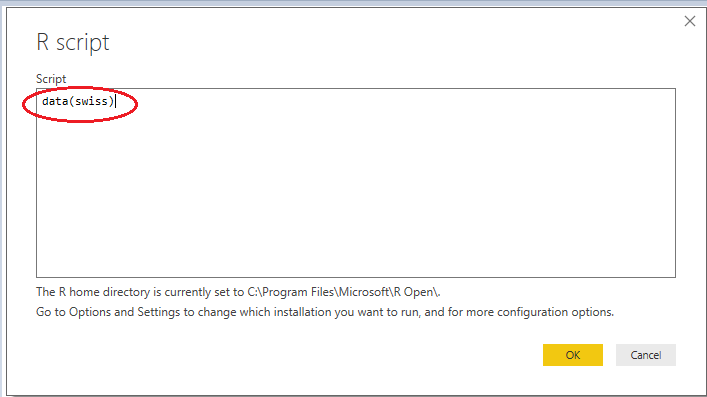
NOTE: You will need to install the R Gui program or Rstudio in PC in advance.

The Future of Big Data
With some guidance, you can craft a data platform that is right for your organization’s needs and gets the most return from your data capital.
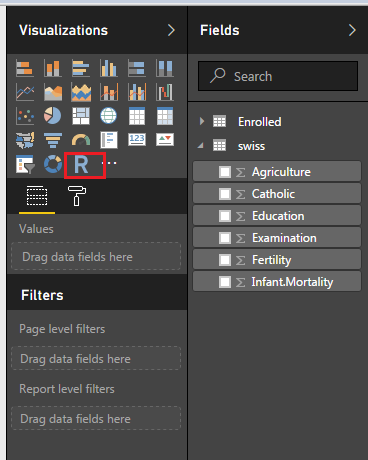
After connecting to R, you can select which table you want to use.

Step 2. Create R Visualizations
After the data has been loaded into Power BI, select the R visual icon from the Visualizations pane. Power BI will create a placeholder on the canvas to host your R visual and then present an R script editor for you to use right on the canvas. As you add fields to the R visual, Power BI Desktop adds them to the R script editor pane.
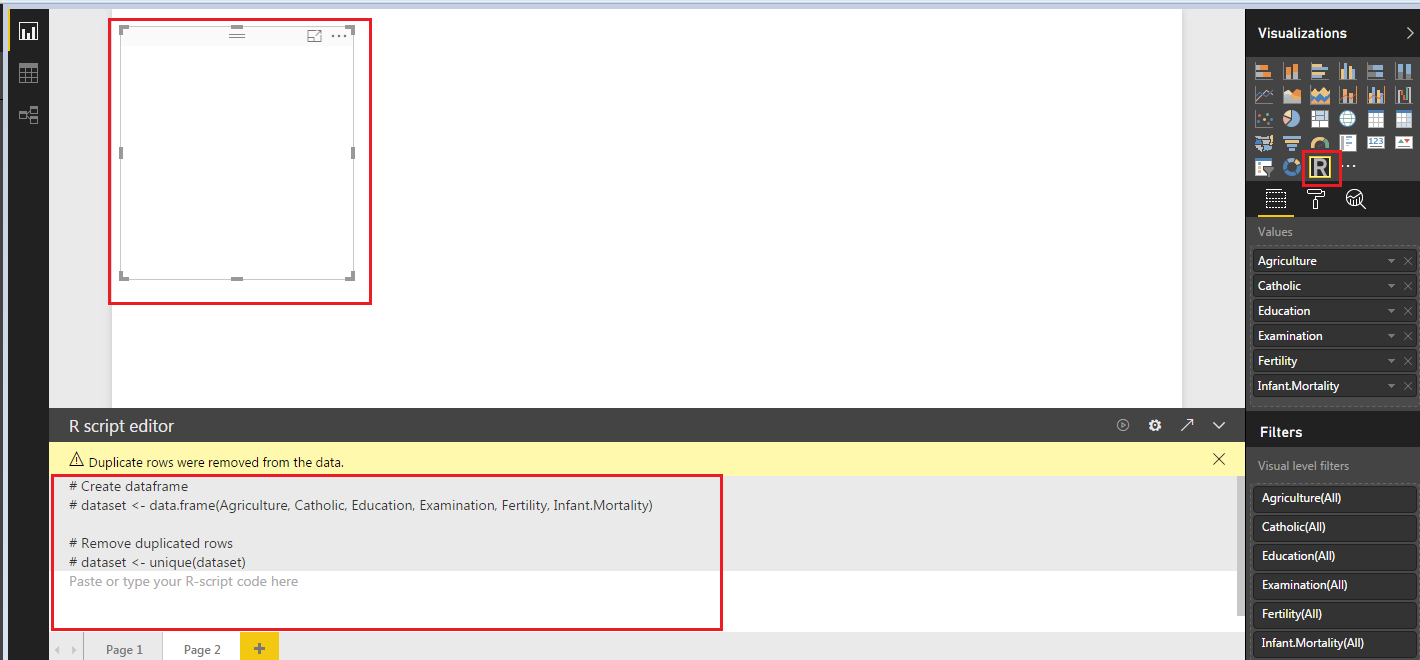
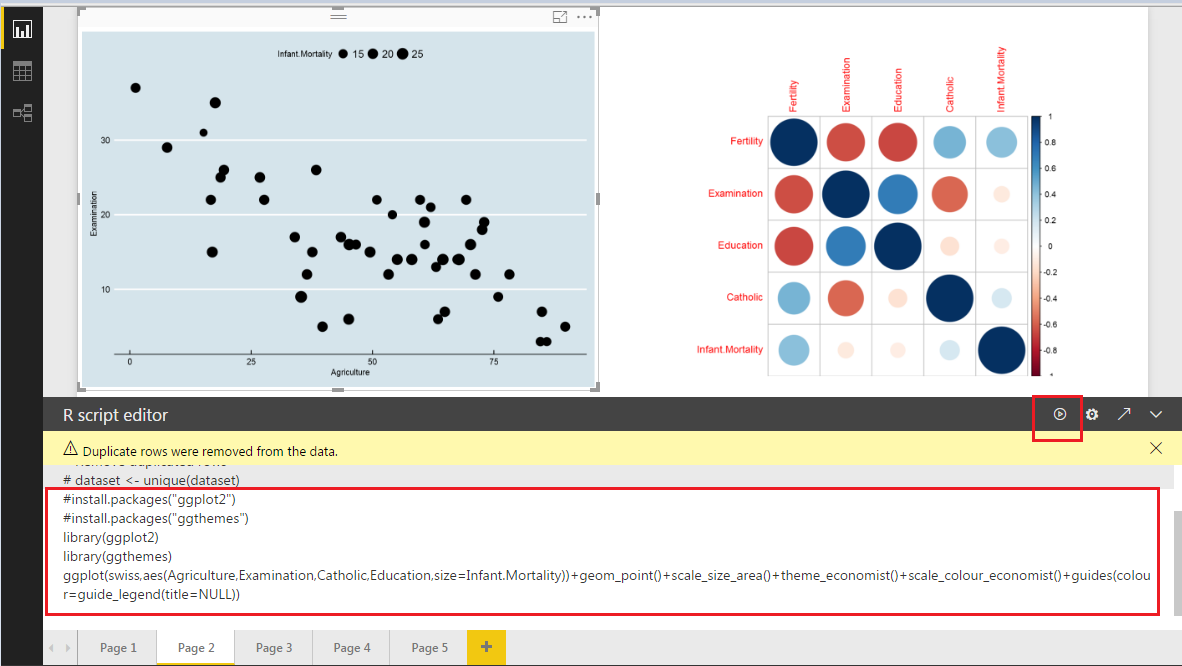
Now you can write and execute the code freely in the R script editor
First, install ggplot2, ggthemes, corrplot in RGui
install.packages(“ggplot2”)
library(ggplot2)
install.packages(“corrplot “)
library(corrplot)
install.packages(“ggthemes”)
library(ggthemes)

Then you can begin creating your R script to generate the visual. Once your script is complete, select Run and the result appears in the R visual visualization on the canvas.