
In today’s IT infrastructure, people demand an open source, centralized log management and network monitoring software. Middle-ware’s role in EAI is to integrate many front end and back end applications together for data compatibility. This makes almost all systems rely on middle-ware for any issue tracking/debugging. When a huge number of logs need to be analysed, traditional Unix scripts or debugging mechanisms don’t provide quick results. In this situation, we use log analysis tools which provide a better analytical overview. If you would like to handle all your log data in one place, then ELK would be one of the best possible solutions.
Logs can be classified based on the application level or system level which includes errors, warnings, and exceptions. Some popular customers using ELK to analyse their logs are Walmart, NETFLIX, Symantec, LinkedIn, and Cisco etc.
ELK is a combination of 3 different products namely Elastic Search, Logstash and Kibana. Since ELK is an open source tool, configuration is a bit easy. ELK can be preferred for lower environments like DEV and UAT. However, in Production environments, huge volumes of data are generated and due to the sensitive nature of the data, we can go for a licensed tools such as Splunk, New Relic which can handle data in the size of Terabytes. Based on the requirements, cost, size and infrastructure for low cost budgets, ELK is well suited.
How Does ELK Work?
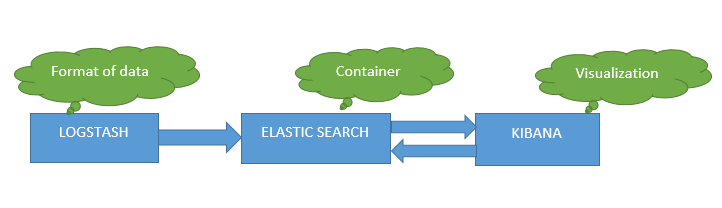
Elastic search is a search mechanism which works based on Lucene search to store and retrieve its data. It can also be called as a NoSQL database which means it stores data in an unstructured way and you cannot use SQL to query it. Elastic search is like a REST API which uses either PUT or POST to fetch the data. Logstash is used to specify the input/output files type and the grog i.e. ‘patterns’ to fetch the data. Grog are the regular expressions that can be written as per the data in the log file.
For Example:
# Syslog Dates: Month Day HH:MM:SS
SYSLOGTIMESTAMP %{MONTH} +%{MONTHDAY} %{TIME}
SYSLOGPROG %{PROG:program}(?:\[%{POSINT:pid}\])?
Kibana is a visualization tool for viewing the data based on the logstash output and grog level patterns specified.
ELASTIC SEARCH
Elastic Search can be downloaded from the below link:
Installation Steps & Configuration:
All configurations for elasticsearch are done in the elasticsearch file.

Provide the cluster.name ,IP address, and http port in the elastisearch.yml file.
Example:
- # cluster.name: XyzLocal
- # network.host: 1.13.12.16
- # http.port: 9200
How to Check if Elastic Search is Installed /Running
- Go to bin (Path where you have installed)
- For Windows environment- run the command ./elasticsearch.bat
- For UNIX Environment-run the command nohup ./elasticsearch
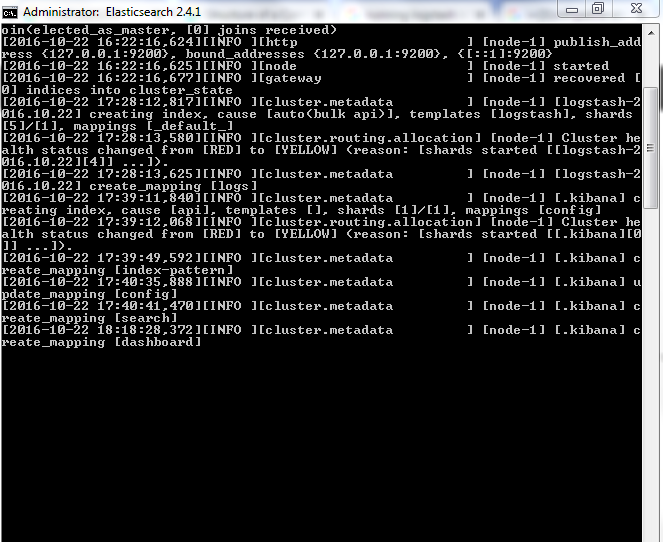
ELASTIC SEARCH CHECK FROM COMMAND PROMPT
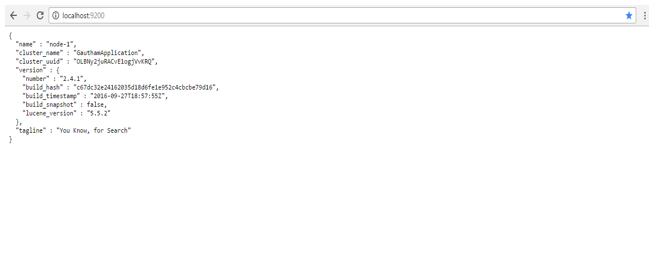
ELASTIC SEARCH CHECK FROM BROWSER
LOGSTASH
Logstash can be downloaded from the below link:
https://download.elastic.co/logstash/logstash/logstash-all-plugins-2.3.1.tar.gz
Installation Steps & Configuration:
Create a config file with input, output, and filter and save it as ‘. conf’ under the config folder.
- ‘Input’ specifies the source folder/destination from files are to be read,
- ‘Output’ specifies where you want your files (folder/destination) which are to be created by logstash.
- Filter specifies how we want the data to be read by logstash or how the user wants to view it. Patterns can be written by using grog levels. Grog are the regular expressions that can be written as per the data in the log file which was explained above.
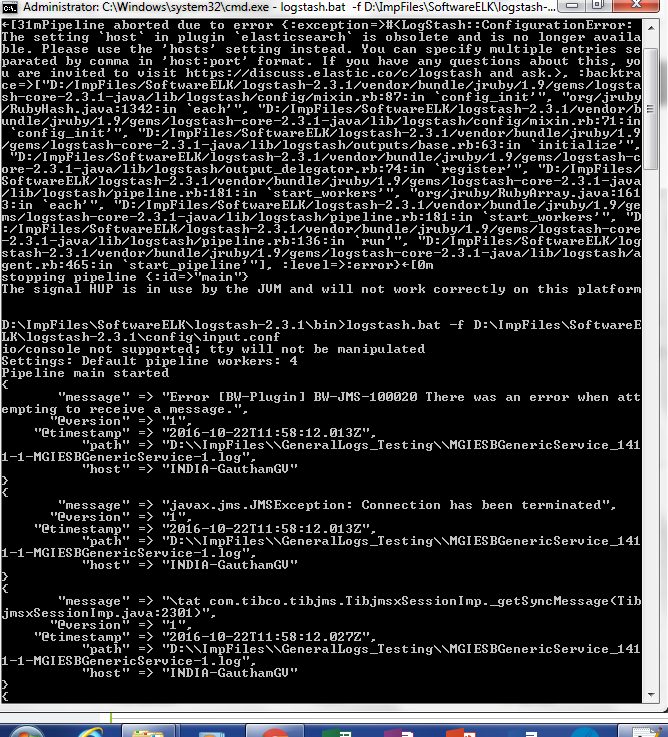
LOGSTASH CHECK – FROM COMMAND PROMPT
Once you have saved the file, try running the ‘logstash.bat’ file under the bin folder. If your configurations are correct, you would get the server started message.
KIBANA
Download Kibana from the below path: https://download.elastic.co/kibana/kibana/kibana-4.5.1-linux-x64.tar.gz
Kibana Configuration Parameters:
Open kibana.yml in the config folder.
Add the below inputs:
- #server.port:
- #elasticsearch.url:
- #elasticsearch.preserveHost:
- #kibana.index:
- #defaultAppId: “
- #elasticsearch.ssl.verify:
- #elasticsearch.requestTimeout:
- #elasticsearch.shardTimeout:
How to Check if Kibana is Installed/Working
- For Windows environment- run the command ./kibana.bat
- For UNIX Environment-run the command nohup ./kibana
If the configurations are correct you will get the below start up message

KIBANA CHECK FROM COMMAND PROMPT

KIBANA VISUALIZATION DASHBOARD
With the above configuration steps, you are ready to use ELK for analyzing your log and viewing the data in a graphical form.
If you have any queries on this implementation leave your queries below and I’ll be glad to assist you! I’m looking forward to hearing your comments.
One of the best ELK Blog , I have seen in recent times. Kuods Gautham !!! Keep up the Good work.