While Siebel developers have always been encouraged to use non-scripting solutions to implement custom business functionality, almost every Siebel Clinical (CTMS) implementation project that I have worked on has included an integration component, and in almost every instance, it has required some coding with Siebel eScript.
But, how do you debug your custom code? For developers just starting out working with Siebel, it is not immediately apparent. In this blog post, I will briefly show you one method of debugging. Keep in mind that, while I am using Siebel 8.1.1.4, the steps are the same for any newer version, all the way through 16.x.
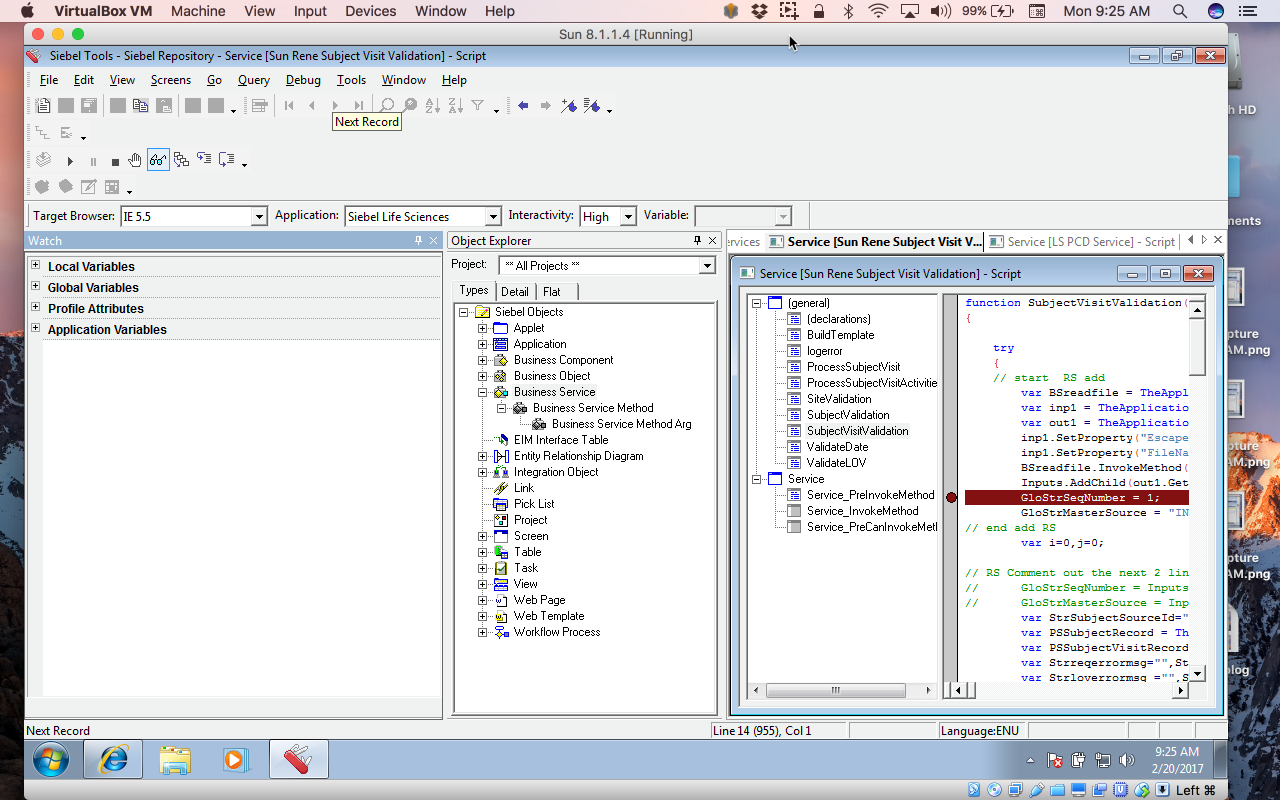
First, launch Siebel Tools and query for the code you wish to debug.
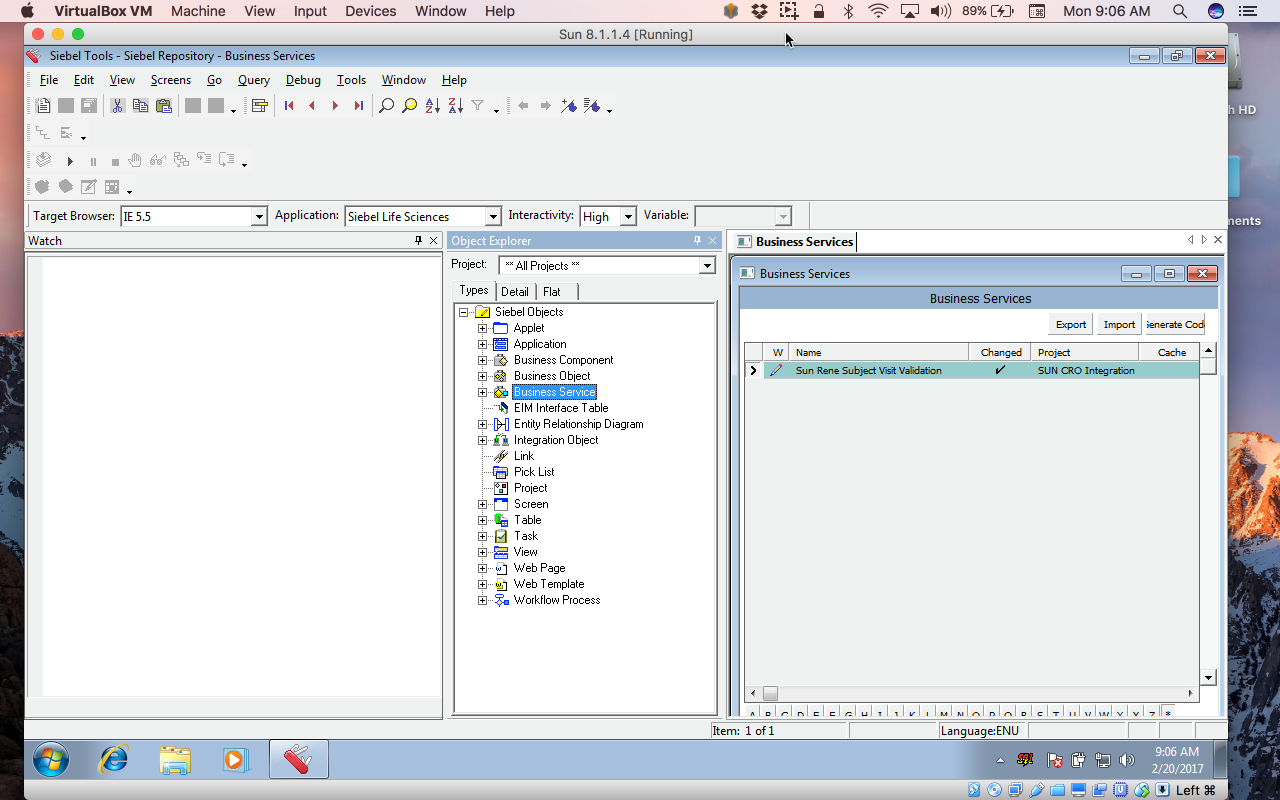
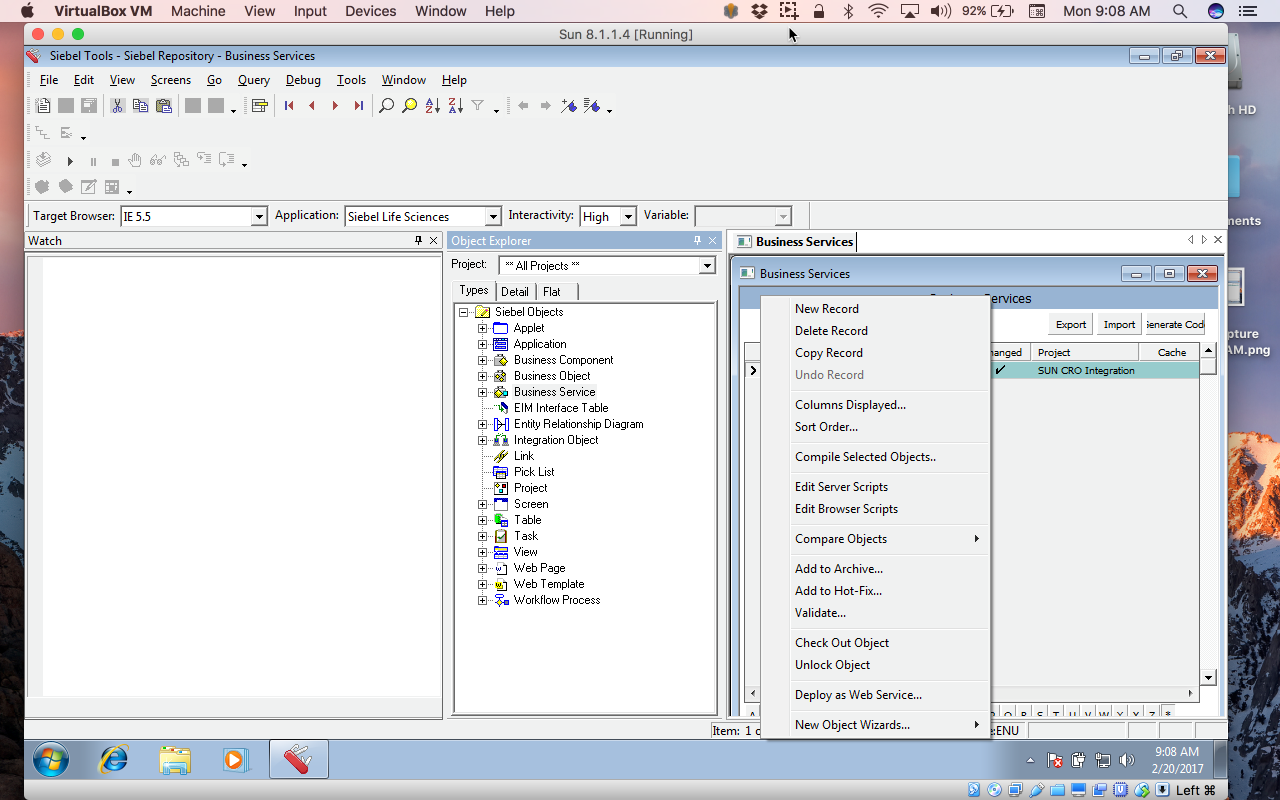
Right-mouse click and select “Edit Server Script.”
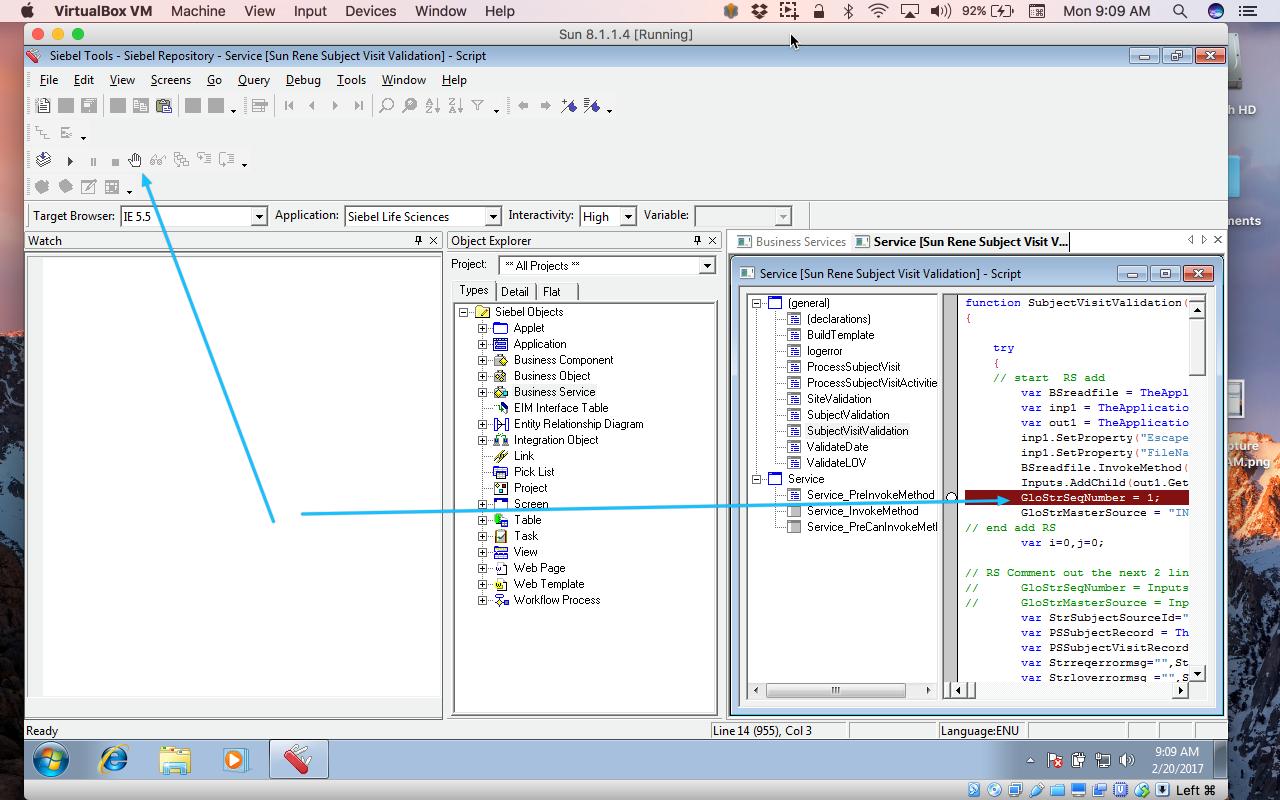
Select the method(s) you want and the line of code you want to start debugging. Press the toggle breakpoint icon. You can set as many breakpoints as you like.
Under the View menu, choose Options, and make sure you correctly fill in all the options under the Debug tab.

Next, select Start under the Debug menu.


That launches the familiar dedicated web client interface.
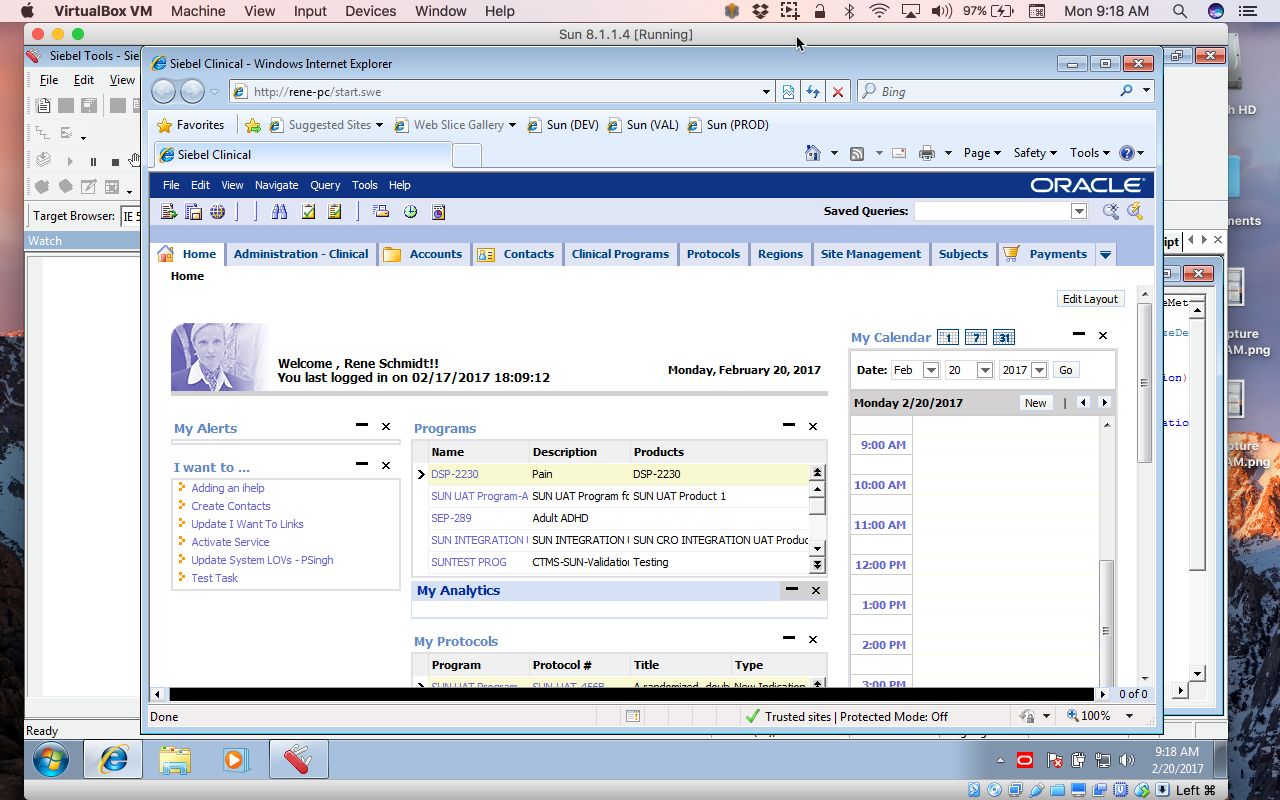
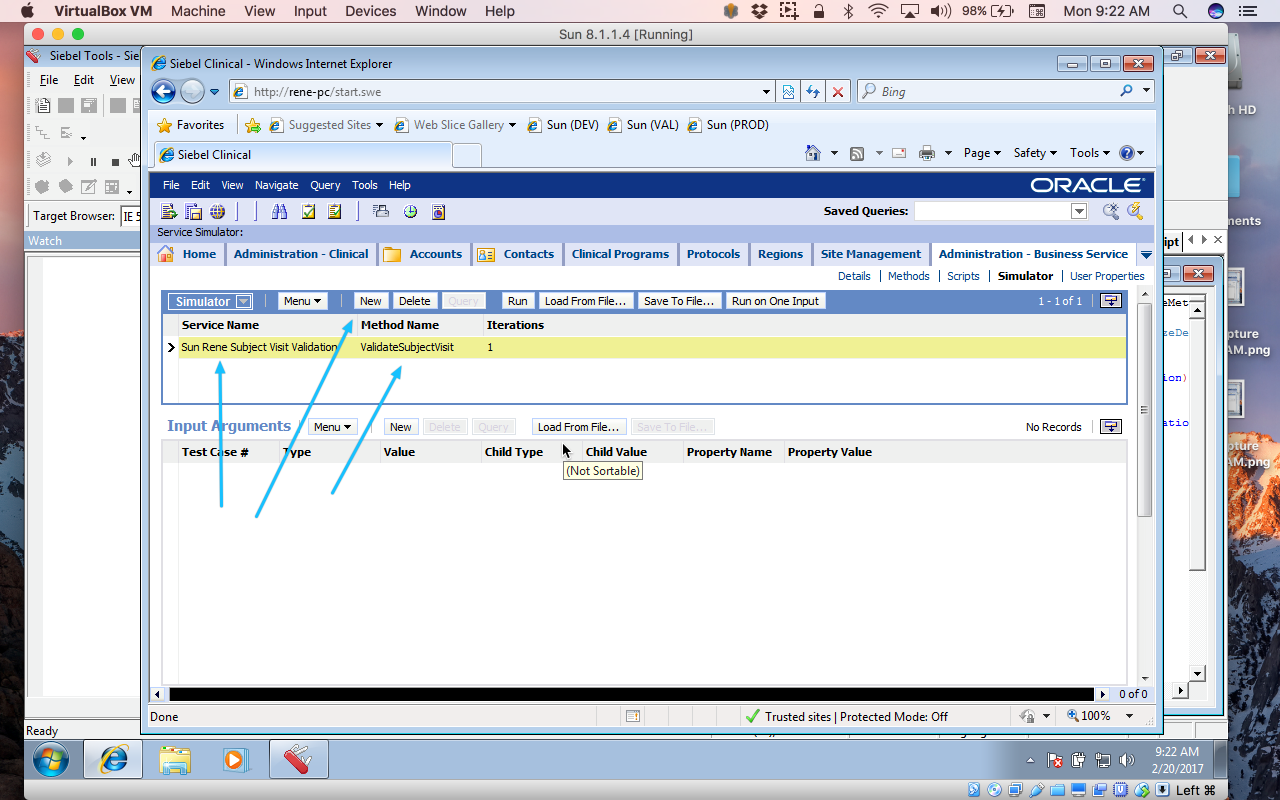
Now comes the part that isn’t very intuitive. In the UI, navigate to the Administration – Business Service tab and click Simulator.

Press New, select the Service Name and Method Name, and then press the Run button.
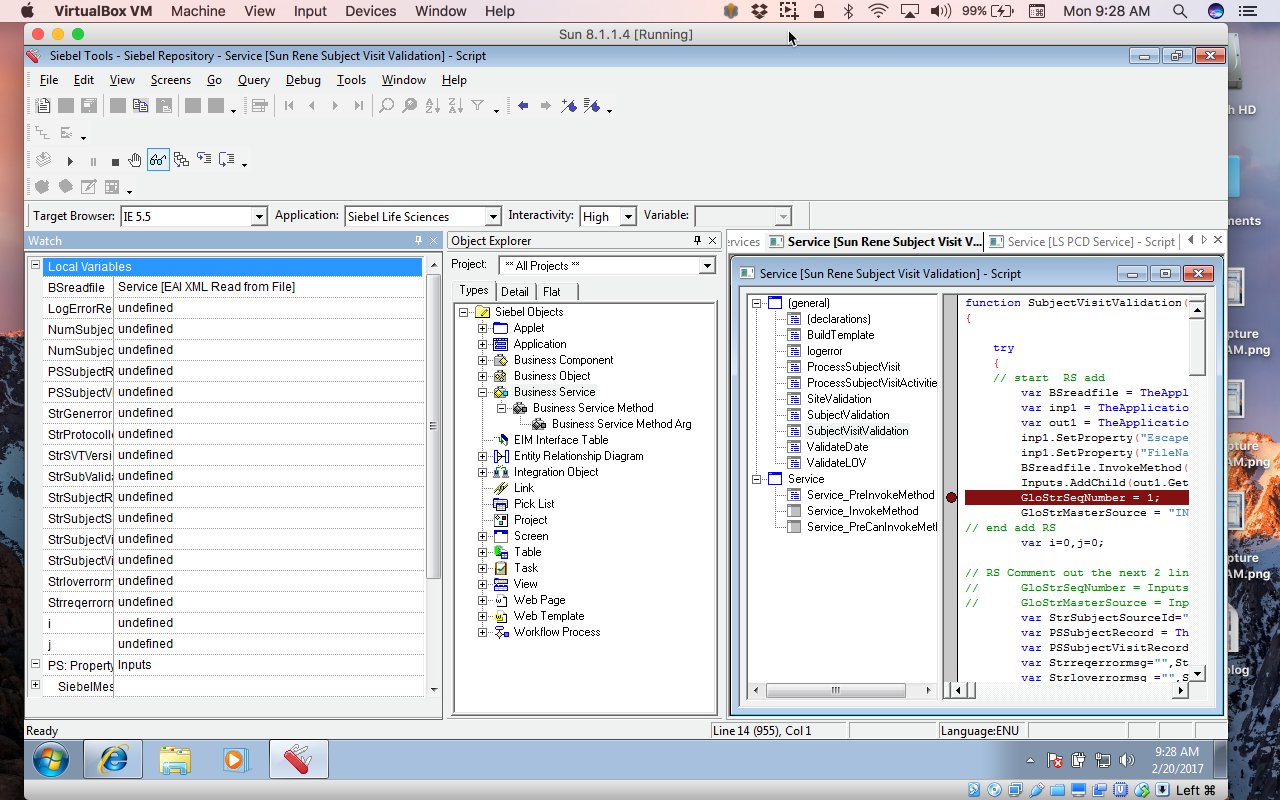
At that point, control is passed back to Siebel Tools, and all of the variables are now available to be examined in the Watch Window.
So, for example, we can look at what the values are for local variables by pressing the + sign.
This final step brings you to the Debug toolbar, where you have the ability to add/remove breakpoints, continue execution to the next breakpoint, or just step to the next line of code.
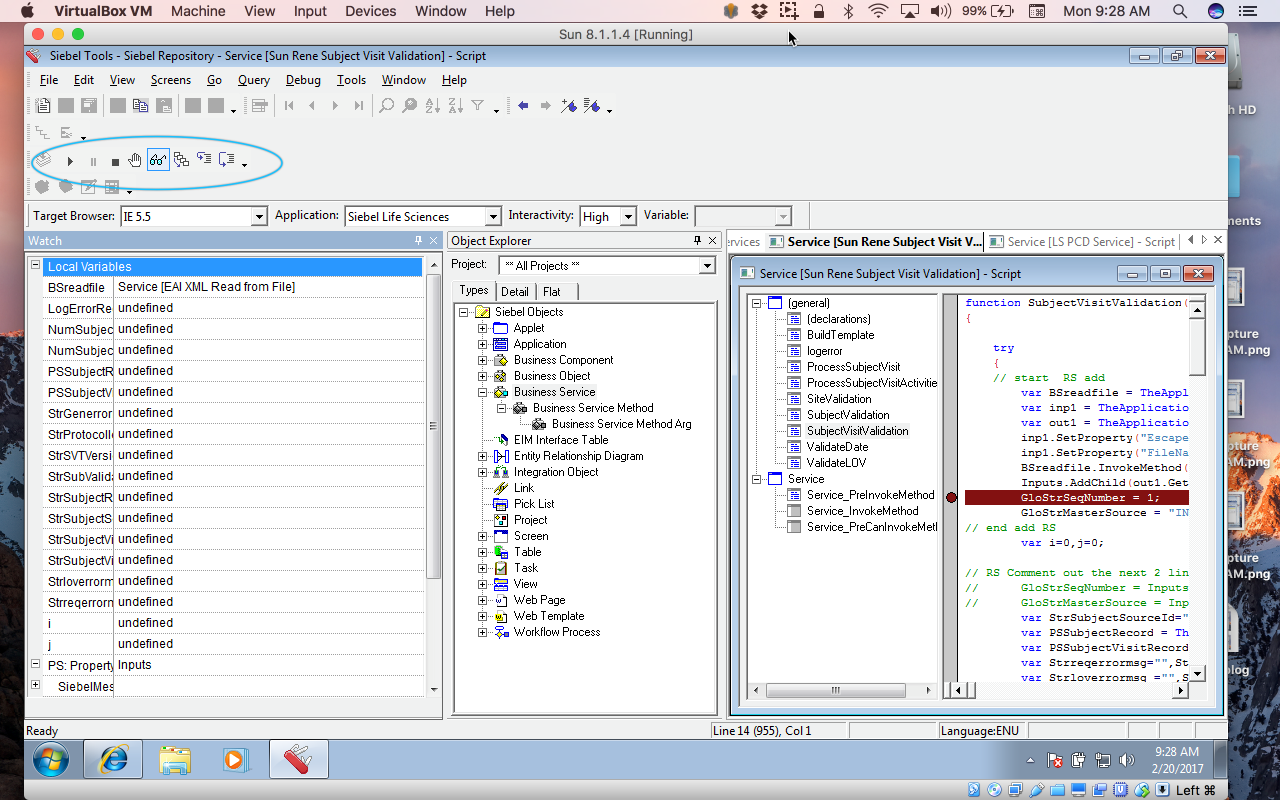
Note: There is a bug that I have come across in many different versions of Siebel where the line of code you are on is not highlighted.
If you are interested in learning more about Perficient’s capabilities, please fill out the “contact us” form in the footer of this page and let us know how we can help.
We will also be hosting a webinar next month, in which we will highlight not only the features and benefits of Siebel IP2016, but the risks involved in upgrading, including a look at computer system validation (CSV) and regulatory compliance issues. A sneak preview of IP2017, based on the insider information we receive as an Oracle Platinum Partner, will also be provided. Feel free to register!