

We live in an increasingly mobile world. The June 2015 comScore US Mobile App report showed that 44% of all digital media time spent was being spent in smartphone apps. Note: that was a percentage of all digital media time, inclusive of time spent on desktop and tablets. If that number isn’t stunning enough, the 2016 comScore US Mobile App report shows that this number had grown to 49%.
If you’re trying to reach a consumer audience, it would seem wise to have some sort of presence in the place where they spend nearly half their time, even if it’s only in the form of advertising within someone else’s app.
Because of the continuing explosion of the app world, we at Perficient Digital decided to put together a survey. This survey focused on shopping and financial apps, as we felt that this would give us some insight into how consumers feel about putting their money on the line. We wanted to learn what were the biggest requirements for survey participants, and what features were most important to them, for both categories of apps.
General Demographic Info
We surveyed 1,004 people. 769 indicated they were women, while 226 were male (9 chose not to share their gender):

Here is the age breakout for our participants:

Here are the income ranges in our survey:

Finally, here is the relationship status of the participants:

In summary, the survey skews:
- Female
- Young (more than 2/3 of our participants were 34 or younger)
- Lower income (the US Census shows the average US household income as $55,775)
Shopping Apps Survey Results
The first of our major question areas focused on shopping apps. First, we determined what apps the participants had installed. Amazon is everyone’s favorite app across all the age groups, genders, and income classes. The following chart shows the percentages of participants that had each app installed:
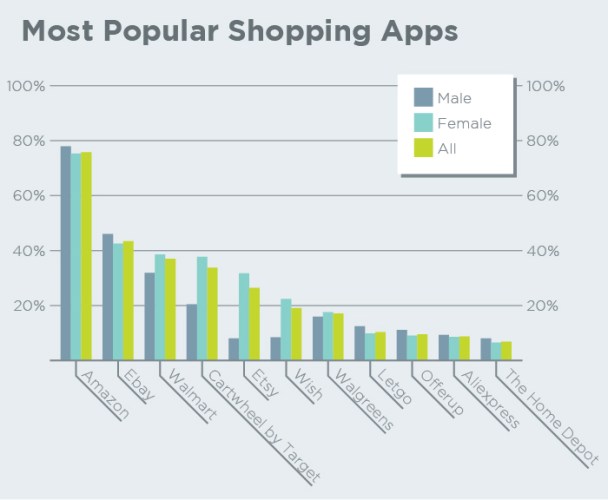
[Tweet “Survey shows Amazon, Ebay and Walmart are the most popular shopping apps. More at” quote=”Survey shows Amazon, Ebay and Walmart are the most popular shopping apps.”]
The above chart shows the following gender preferences:
- Female: Cartwheel by Target, Etsy, Wish
- Male: slightly greater propensity to use Letgo
Note that in contrast, comScore 2016 Mobile App Report data shows an install rate for Amazon of 34%, or less than half of what was shown in our data, and we see similar disparities with some of our other apps. However, this is likely because our audience skews very young.
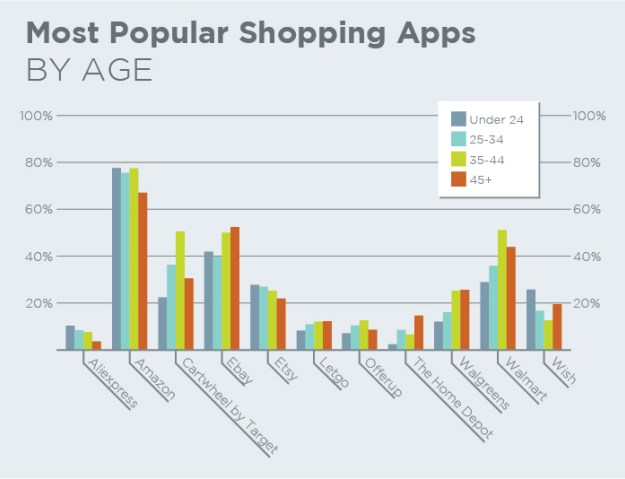
Even so, there are some apps that saw higher percentage installation rates with older age groups. These include Walmart, Ebay, Walgreens, and Cartwheel by Target, all of which are installed most by people 35 years of age and older. Here is the breakout of installation rates by age:
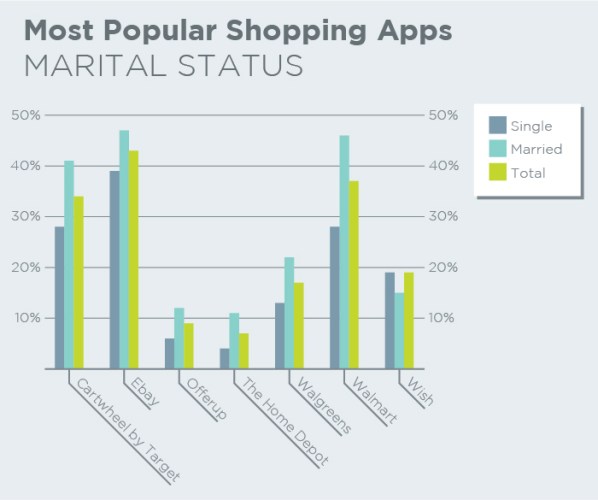
There are also some apps that tend to vary based on relationship status. For example, Walmart, Cartwheel by Target, The Home Depot, Offerup, and Walgreens apps are installed most by those that are married. There appears to be some bias for married people towards the eBay app too, though this is less marked.
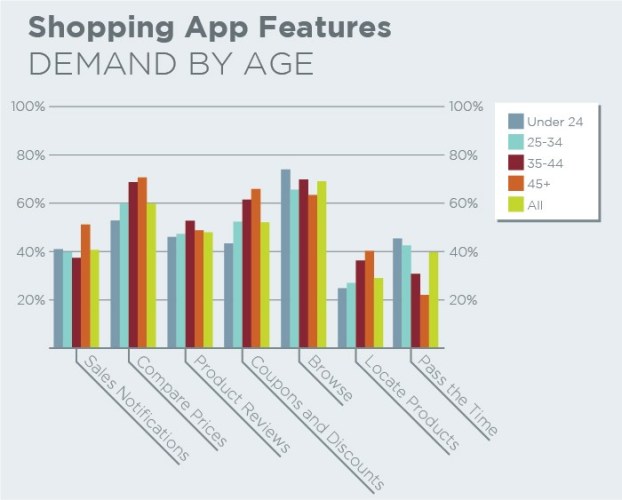
Next, we asked people to comment on how they use shopping apps. The most common uses were to browse to see what’s available, compare prices, and to find coupons. It appears that men focus a bit more on product reviews, and women focus a bit more on coupons or discounts.
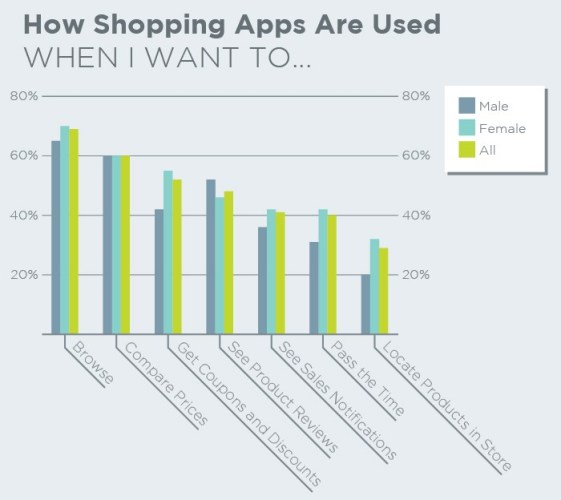
[Tweet “Survey shows shopping apps used most to browse products, compare prices and get coupons and deals. More at” quote=”Survey shows shopping apps used most to browse products, compare prices and get coupons and deals.”]

When examining usage, patterns based on age, comparing prices, coupons and discounts, and locating products seems to be a bigger concern for those that are 35 or older, while using a shopping app simply to pass the time is a younger person’s activity (34 and younger).
We also asked people to rate certain shopping app features and attributes, giving each a score from 1 to 5, with 1 being “not important at all”, and 5 being “very important”. We then calculated an average score for each.
We found that the number one concern is transaction security (and that’s a good thing!). The number two thing people were looking for was product images, but as a bit of an odd contrast product videos were one of the lowest rated features, as was a search by pictures function. It seems like once they’ve seen it, there is no need to go much further than that. Reviews for products also scored relatively high, but product recommendations not so much.

[Tweet “Survey shows that shopping app users want product images but don’t care about product videos. More at” quote=”Survey shows that shopping app users want product images but don’t care about product videos.”]
From a gender perspective, men are a bit more into video, and women are more into “coupons and discounts” and “save to cart”. Per the following chart, we did not see any major trend in terms of age driving a different level of demand for one feature over another.

We also took this one step further to see how people’s demand for a feature varied based on which shopping app they have installed. So, for example, we saw that 78% of responders who say that they have Cartwheel by Target installed on their phones like to use shopping apps to find coupons and discounts.
63% of people who have the Home Depot App installed on their phones use shopping apps to locate products at one of the brand’s local stores. For Wish users, 58% of the respondents say they like to use shopping apps to pass the time.

When it comes to features, we also saw some interesting disparity based on the apps users had installed. For example, even though product video was not a highly rated feature, it mattered most to those that have Wish installed (3.32 out of 5), and least to those with Amazon (2.63 out of 5).
The “knows my location” feature scores highest for users of the Home Depot app, with a score of 3.16 out of 5, and this makes sense because a lot of the application for the feature is for in-store navigation.
Financial Apps
Because our survey audience was being compensated for their participation via PayPal, we had to ignore that app for our survey. With that noted, the most popular apps were those from financial institutions (for example, their banks) with 53% of participants having those installed. Apple Pay was next, at 26%.
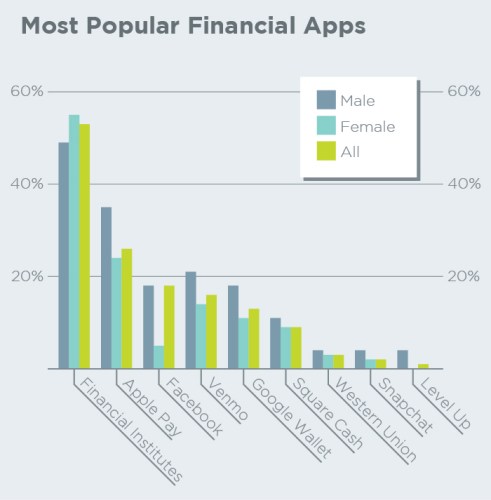
[Tweet “Over half in our survey prefer financial apps from their bank. Apple Pay was #2. More at” quote=”Over half in our survey prefer financial apps from their bank. Apple Pay was #2.”]
It’s interesting to note the sizable gender gap for Facebook, with men being 3.5x more likely to use Facebook as a financial services app. Others with a clear male bias were Apple Pay – 35% vs 24% for women, Google Wallet – 18% vs. 11%, and Venmo 21% vs 14%.
Venmo skews heavily to those 34 and under. SquareCash towards to the 25 to 34 age segment.

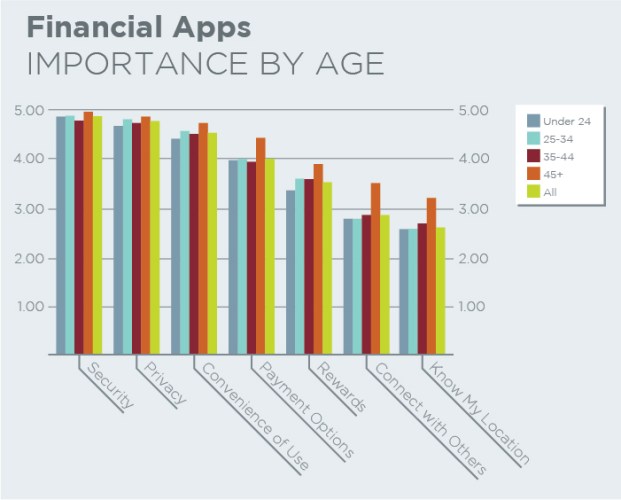
Security and privacy are the runaway most important features for financial services apps. Ability to know my location and ability to connect with others, not so much. We did not see any major variation based on age across these feature requirements.
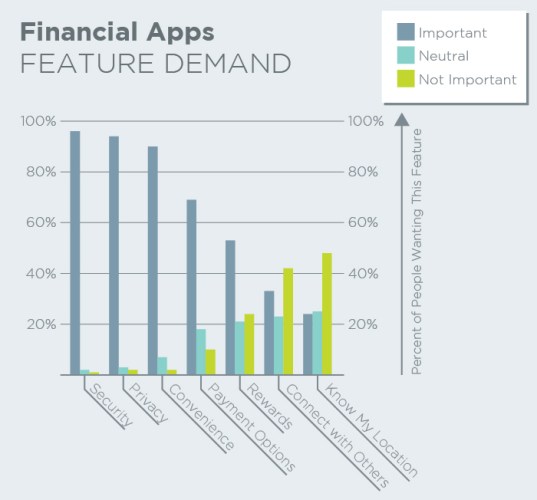
[Tweet “Users of financial services apps value privacy and security above all other features. More at” quote=”Users of financial services apps value privacy and security above all other features.”]
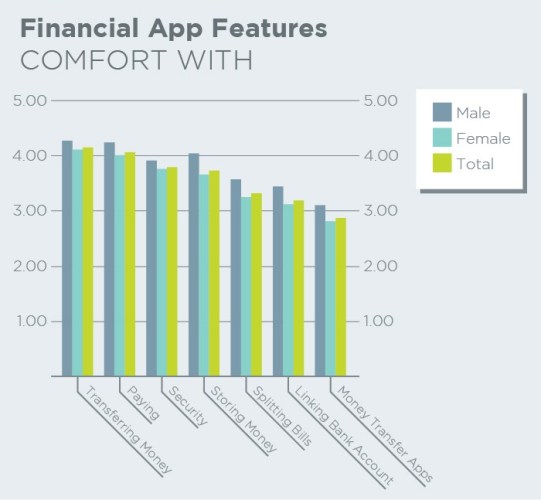
Women appear to value security and privacy slightly more than men:
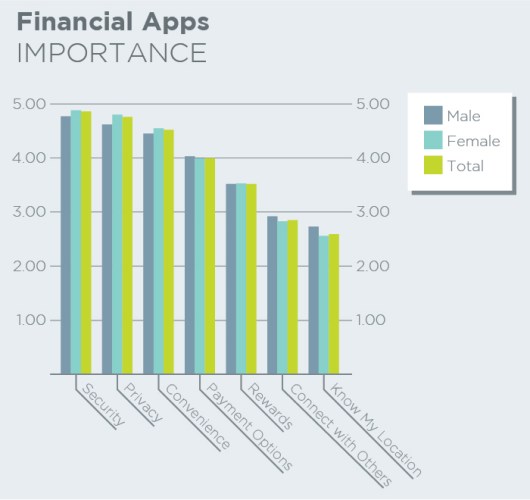
In contrast, men feel more comfortable in every category than women:
Regarding these features, we didn’t see any marked variation in bias based on the ages of the respondents:
There was only one clear issue that emerged when it came to people feeling comfortable with financial services apps, and that involved transferring money. People 45 and older were clearly not as comfortable with that, scoring only 1.79 out of 5, as compared to an average survey score of 2.87 out of 5.
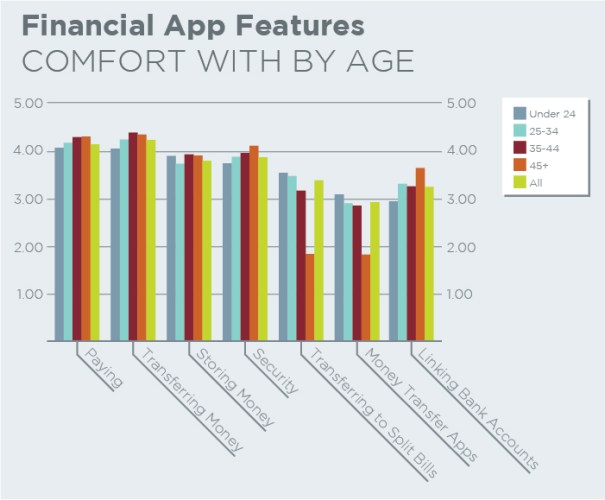
[Tweet “Older people are more reluctant to transfer money via an app than younger users. More at” quote=”Older people are more reluctant to transfer money via an app than younger users. “]
Why Do People Uninstall Apps?
As a final bonus question, we also asked people to tell us why they remove apps from their phone. The main causes were too many ads, app crashes, and freeing up space.

[Tweet “Why do people remove apps? Too many ads or crashes, and to free up space. More at” quote=”Why do people remove apps? Too many ads or crashes, and to free up space.”]
Summary
Apps are increasingly important, and the trend seems to be continuing. It seems likely that by the June 2017 comScore US Mobile App report the percentage of digital media time spent in them will exceed 50%.
As you can see from this report, there are some clear areas that matter most to users of financial and shopping apps. For example, in a shopping app, transaction security and having product images are musts. Yet, other seemingly similar features, like a product video, don’t matter much at all.
The lesson might be that it’s far better to focus on getting the basic functions to a very high level (e.g. pictures for every product) then it is to add bells and whistles that don’t matter much to users at all.
I bet people are more interested in shopping apps when they have the money to spend and more in finance or business apps when they want to earn. So they are interested in both, just depends on their intent.
Nice Article Keep up your work. Thanks man for interesting info.