
CMO.com, which is published by Adobe, provided an infographic on the state of digital marketing by industry. Although they list only five industries, the insights presented are interesting. I have linked to the infographic on SlideShare.net below. Here are some interesting tidbits if you don’t have time to look through the infographic right now:
- Naturally, retailing leads the way in the amount of ad spending. The spend is split almost in half between desktop devices and mobile devices.
- It is surprising to me that Financial Services is second on the CMO list of ad spending. Again their ad spend is split almost 50/50. However, one insight cited in the infographic is that “More advertising dollars are being shifted toward mobile devices to promote financial mobile transaction platforms and to service customers across channels”.
- Viewing of travel videos peaked between 3 pm and 10 pm. My question is this: Is that because Youtube is blocked at so many companies, or are we just wanting to view these videos when we can share them with our travel partners?
- For B2C high tech companies, 60% of online shoppers looked at reviews before deciding to buy.
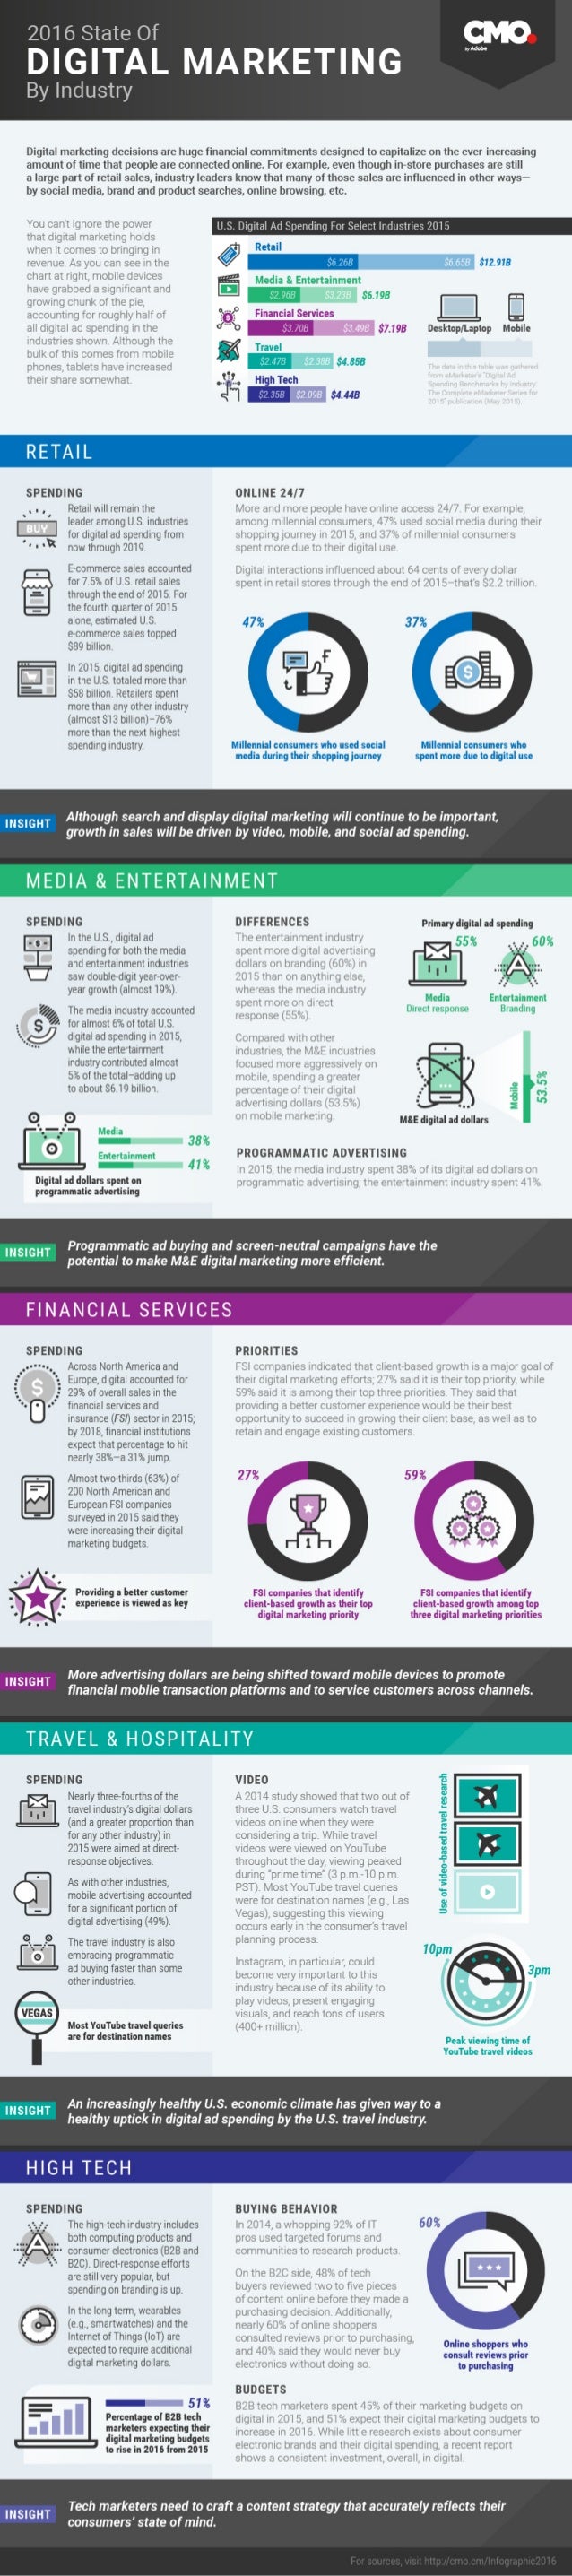
2016 State of Digital Marketing Infographic from CMO.com
2016 State of Digital Marketing Infographic
Thanks to CMO.com for the insights.