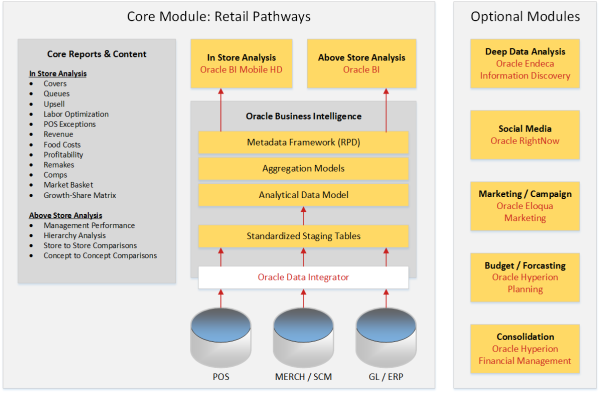
Perficient is exhibiting and presenting this week at KScope14 in Seattle, WA. On Monday, June 23 I presented my retail-focused solution offering built upon the success of Perficient’s Retail Pathways, but using the Oracle suite of products. In order to focus the discussion to fit within a one hour window I chose restaurant operations to represent the solution.
Here is the abstract for my presentation.
Multi-unit, multi-concept restaurant companies face challenging reporting requirements. How should they compare promotion, holiday, and labor performance data across concepts? How should they maximize fraud detection capabilities? How should they arm restaurant operators with the data they need to react to changes affecting day-to-day operations as well as over-time goals? An industry-leading data model, integrated metadata, and prebuilt reports and dashboards deliver the answers to these questions and more. Deliver relevant, actionable mobile analytics for the restaurant industry with an integrated solution of Oracle Business Intelligence and Oracle Endeca Information Discovery.
We have tentatively chosen to brand this offering as Crave – Designed by Perficient. Powered by Oracle. This way we can differentiate this new Oracle-based offering from the current Retail Pathways offering.
The Future of Big Data
With some guidance, you can craft a data platform that is right for your organization’s needs and gets the most return from your data capital.
At its core, Crave leverages the star-schema model of Retail Pathways, but includes updates specifically designed to enable native Oracle Business Intelligence features. We also offer the same set of proven core reports for both in-store and above-store analysis. These core reports, however were designed with a “mobile first” approach for use by restaurant operators.
A new type of data analysis included in Crave is the Growth-Share Matrix report. Invented in 1970 by Bruce D. Henderson for Boston Consulting Group, this scatter graph ranks items on the basis of their relative market shares and growth rates. By using the contribution margin of each item along with its popularity and popularity growth we are able to identify four types of products.
- Stars: Menu items generating strong sales which may cost a lot to produce.
- Question Marks: Menu items gaining popularity which require tweaking or investment to make profitable
- Cash Cows: Menu items that are easy to make, low-cost, and are responsible for a larger share of profits.
- Dogs: Menu items that don’t sell well, but are perhaps also low cost.
By identifying these classes of menu items we begin a process of evaluating candidates for investment or divestment.
The complete KScope14 presentation is available.


