
Are you using Google AdWords and Google Analytics to their full potential? In this interview, Google Analytics Advocate Justin Cutroni discusses how to make the most of Analytics and AdWords integration, from the most basic set up techniques to advanced reporting features that you may not have been aware of.
Key Points
- Analytics and AdWords are made to be used together. While AdWords helps advertisers measure ads and their performance, Analytics helps you understand what happens to traffic when it gets to your site.
- AdWords/Analytics users should be carefully analyzing on-page factors (bounce rate, pages per visit, conversion rate) in conjunction with off page factors (keyword performance, ad copy, ad groups, etc.) to determine a campaign’s effectiveness.
- When configuring goals in Google Analytics that are not eCommerce, it is beneficial to create a value for them and track them as revenue.
- Weighted sorts apply an algorithm that compares metrics by their weighted importance. For example, a weighted sort of bounce rate would show you which keywords have a high bounce rate and at the same time are contributing to a large amount of website traffic.
- By using the Day Parting feature of Google Analytics, users can decide which times of the week are the lowest/highest converting, and decrease/increase bids for these specific time slots. For example, a Pizza Parlor might convert higher on Friday nights, and thus increase their bid 150% for this particular time.
- By using the Matched Search Queries function in conjunction with secondary dimensions, you can compare what someone types into Google to what it matched in your AdWords account.
- When you are looking through data in AdWords, you should be thinking: How does my business work? What do I know about my customers? How does my day go? Tailor your campaigns to meet your business needs.
- Multi-Channel Funnels allow you to visualize your personal sales cycle. A paid search visitor may not convert on their first visit, but they might convert week later in a return visit.
- Within Multi-Channel Funnels there are two very important reports: Time lag and path length. Time lag analyzes the time and date between a visitor’s first entry and the conversion. Path length measures the number of visits between the first entry and the conversion.
- The increase in reporting capabilities is also making the Display Network more measurable and effective. By using Multi-Channel Funnels you can carefully pinpoint what value a Display Network ad has in your sales funnel.
Full Interview Transcript
Eric Enge: Could you provide an overview of the “how and the why” of Google Analytics and Google AdWords integration?
Justin Cutroni: I think Analytics and AdWords were made to be used together. AdWords helps advertisers reach an audience and understand ads and their performance, but is missing a lot of data about what happens to your traffic when it actually gets to your site. Analytics steps in and fills that hole.
Analytics helps you understand, at a rather deep level, the behavior of people coming from AdWords. Because Google controls both of these products, you can view reporting and data in Analytics that directly relates back to your choices in AdWords.
The best part about this whole thing is that you are getting data to drive the refinement of your AdWords campaign, in order to improve the performance of your business.
Eric Enge: What are the kinds of things that you need to do to set up AdWords and Analytics so that they work in an optimal fashion?
Justin Cutroni: There are really two key ways to make sure Google Analytics and Google AdWords are working together. The first is within analytics:
You need to make sure you are tracking goals, or have eCommerce tracking enabled.
This allows you to track the transaction, the revenue, and the conversions on your site. If you are not eCommerce, you can use a feature called “goals,” which is analogous to conversion tracking in AdWords. This lets you track form submissions, leads, whitepaper downloads, etc.
The idea is to make sure that you understand what you are spending and what revenue this spend is generating. A little tip here: when you are configuring goals in Google Analytics that are not eCommerce, you can actually add a value to them. So, for that whitepaper download, try to create a value and put that into Google Analytics, and it will actually track it as revenue.
The second setting that is really important is linking AdWords in your Analytics account. This does two things: First, it automatically identifies traffic coming from AdWords in your Analytics account, so you don’t have to do any manual setup. Second, it pulls in your AdWords data, statistics like impressions, click-throughs, and cost. This allows you to carefully analyze what your spending and what you’re making, and optimize based on those metrics.
Eric Enge: Let’s go back to goal-setting for a moment:
Somebody goes to your white paper download page and they say: “I want to download this white paper.” Presumably, you make them give an email address and once that is done, you have a landing page which might be the trigger that indicates that the goal has been met. You then apply a dollar value to that based on how you value it as a tool towards eventual sales. Is this how it works?
Justin Cutroni: That is absolutely correct. You tell Google Analytics: “Hey, this page on my site is special.“
In the example you gave, you put email conversion as a goal and when someone hits that page, it will count as a conversion. It is a little bit different than AdWords, where you would have to put a special piece of code on your conversion page. You don’t have any special conversion for Google Analytics. It is all about telling Google Analytics: “This URL represents a conversion.”
Eric Enge: Once set up properly, what should people be doing on a day-to-day basis with Analytics and AdWords?
Justin Cutroni: Once everything is set up, you are going to notice in your left-hand navigation of Google Analytics that there is a section for Advertising. It contains the AdWords reports.
The campaigns report is the most basic report, but gives you all of the data you need to evaluate the performance of AdWords. It is structured just like your AdWords account, so you will see a list of all of your campaigns, with the ability to drill down into ad groups and keywords. It rolls the data up, just like it is in your AdWords account.
What is different now, is that we have metrics that are all about what is happening on your site. This includes traffic, visits, behavior, page views, time on site, and outcomes (goals, conversion rates, and revenue from eCommerce.)
One of the metrics that I really like is bounce rate. A lot of people know about bounce rate, but it is a good thing to reiterate. Bounce rate is when someone comes to your website, they land on a page, and then they leave immediately from that page, without going any deeper into the site. One thing that I am always interested in analyzing with the campaign report is: “which of my campaigns have a really high bounce rate?”
Then, you can start to drill down and look at the ad groups and identify which ones have a really high bounce rate. This will tell me which ad groups and keywords are driving traffic to my website but not doing anything else. So, if I am putting people on product pages or putting people on product category pages, my expectation is that they are going to move deeper into the site. If they are not, something is not working. There is some type of disconnect between the ad that they are seeing and them landing on the site.
I like the bounce rate in this report because I can look at it at different levels: campaign, ad group or keywords. Very often, if you just look at the campaign level, you could be missing some outlines that are getting obscured by averages. Having the ability to drill down is really important. To me, that is one of the most basic things that I think everyone should do be doing: understanding if the campaign is successful or not, and using that in conjunction with the Bounce Rate to see if there a problem between the stickiness of your landing page and the ad that you are showing people for certain keywords.
Eric Enge: I think the key advantage is the ability to slice at multiple levels. The ability look at keywords, ad groups, or campaigns…
Justin Cutroni: Absolutely. You don’t want to be too far “up” and you don’t want to be too far “in the weeds”. That’s why I like ad groups as a nice middle road. It is not too high, and it is not too low.
Another really useful tool in this report is something that gets a little bit advanced. You can click on the heading of different columns and you can sort based on that column. So, if you click and you sort by bounce rate, normally everything that has a hundred percent bounce rate will show up at the beginning of the table.
However, that is not very useful, because you will see one visit from an ad group or from a campaign or from a keyword, that has a one hundred percent bounce rate, which is not very actionable.
But at the top of that table, there is a sorting option called the weighted sort.

Weighted sort applies an algorithm to the data and sorts based on the traffic volume and the bounce rate. So, you may have a campaign or ad group that gets seven hundred visits and has a bounce rate of 73%. The algorithm can detect, based on the volume of traffic and the bounce rate, this is something that you should address. I think that’s a really neat tool doesn’t get as much attention as it should.
Eric Enge: It does sound like a neat tool because, without the tool, you would have to go through on your own and figure out: “Am I getting enough data here?” Now you can click on a button and have it just happen.
Justin Cutroni: We are really blessed at Google to have some pretty smart people. You can walk in and say: “What if we could magically show people what they should be looking at first and paying attention to first?”
Then someone will say: “Sure, I can make that this afternoon for you.”
I should mention that the weighted sort will work on any column that is a percentage. You can switch the view to look at your different goal conversion rates, and you can also switch it to eCommerce data to look at the transaction rate.
I like switching those columns because I can get conversion rates or eCommerce transaction rates. I can do the same type of analysis for the eCommerce transaction and apply a weighted sort. This allows me to easily see where the really good campaigns or keywords are and investigate these a little bit more to promote them.
Eric Enge: Right, because oddly enough, it is not just about clicks, it is about conversions at the end of the day.
Justin Cutroni: Right, a lot of times what will happen is you will be looking at these reports and see that campaigns are driving traffic but no conversions or outcomes.
As we go deeper into the conversation, I will discuss some other tools that will help you dig into those campaigns a little bit deeper. Just because something is not driving a lot of conversions directly doesn’t mean that you should turn it off. We have a great feature called Multi-Channel Funnels, which we will get into it in a few minutes. It will take your analysis to the next level and help you understand if certain visitors that you may think aren’t driving conversions, actually are.
Eric Enge: So, in our world of paid search marketing, when we first grew up, it was just viewed purely as a direct response market place. Get someone to click on something, some percentage of those people buy something, do the evaluation and now you know whether it is a profitable keyword. It is obviously a bit more complicated than that today.
Justin Cutroni: Yeah, the behavior of people is changing radically because of the devices we have, how we split our time between different devices and how we search. We are trying to give advertisers as much data as possible to make good decisions.
Eric Enge: I know we do want to get into some deeper topics, but are there some other things that you want to fill in at the introductory level before we take it to the next stage?
Justin Cutroni: Yes, let’s play on this theme of data in Analytics to help you understand the choices you have in AdWords.
I think that, looking at the campaigns in ad groups is good, but let’s talk about a feature in AdWords called day parting. Anyone that has been running ads knows that you can run ads at different parts of the day. This is one of my favorite things to do because we have so much data in Analytics about people’s behavior and the ability to segment that based on time on your site. We can use that information to fine-tune your AdWords campaign.
In the same section of Google Analytics (Advertising > AdWords) there is a day parts report:
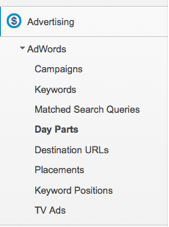
This report shows you the AdWords data by the day of the week or the time of the day. You can see your traffic based on Mondays, Tuesdays, Wednesdays, etc. or even by the hour of the day. This is really important because there is a feature in AdWords where you can change your bidding based on the day of the week or the hour of the day.
Now you can understand the cyclical nature of your website traffic and optimize accordingly.
So, most of the websites that I am seeing, you see traffic on Mondays, it peaks during the week and then on the weekends it usually starts to slow down. However, that’s going to be different for every business.
If you have a lot of traffic and a really high conversion rate at some point during the day for campaigns, you might want to increase your bids some percentage higher than a hundred percent (140% or 130%) because that’s a really good time of the day for your business.
Likewise, if you see traffic drop off and conversion rates drop off on the weekend, you might want to throttle back, maybe 50% or 60%, save some money during those times because when the audience isn’t there, you are not converting. This a really good feature that you can start to leverage immediately.
I will say that so much of AdWords is in making incremental changes. You may not want to double your spend on a certain part of the day, but rather just start to creep it up a little. You may not want to completely turn it off on the weekends, just throttle it back a little. It is all about the incremental changes based on the information you get.
Eric Enge: Right, so you might do something like jack your bids 20% during a hot time and take them down 20% in a slow time. Big enough so you are going to get a measurable result and find out if it was good for you, but not so big that it goes off the deep end if something is wrong. At the end of the day, even though I know we are going to talk about some very sophisticated tools, you do have to rely on your ability to test and see what works.
Justin Cutroni: Yes, I think what you just said is so important.
You still need to be getting some data to understand: Is it moving in the direction that you expect it to? If there was a magic bullet, you could push a button in Analytics to make a million dollars today. But there is not, and it is all about making these small incremental changes and reacting over time.
Eric Enge: The other part of that is making sure the change is large enough that you will be able to measure the result without having to wait several months to see it. You want to get statistically significant data reasonably quickly, just not necessarily crazy quickly.
Justin Cutroni: Exactly.
Eric Enge: So you discussed day parting and hour parting. Are there people that find that there are volume drops after the workday?
I have been involved in internet marketing long enough to know that most people do their online shopping when they are supposed to be doing their jobs. So you might actually have campaigns where after 7 at night, you begin to tweak the bids back and maybe early in the morning they are kind of normal and maybe in the afternoon they are tracked up a little bit. Whatever it is that you see from looking at the data, but that’s another thing that you can do in AdWords too, isn’t that right?
Justin Cutroni: Absolutely, and I think you bring up another good point.
What I hope people take away from this is that when you are looking at this data, the first thing that should be in your mind is how does my business work? What do I know about my customers? How does my day go? Imagine that if you are a small business and you have to run deliveries between 12 pm and 3 pm. Maybe you can’t handle any leads during that time for whatever reason. You might just turn AdWords off because you know that any leads that are coming in during that time will not get handled and you can’t deal with them. It really is about understanding the flow of what you do and how your business runs and then reflecting that in AdWords.
That’s why I think the Analytics data is really such a critical piece. It is data about your specific business.
Eric Enge: Any sense as to what kind of scope of impact people are seeing? Have you seen advertisers get dramatic impact from day and hour parting?
Justin Cutroni: We know you are going to see an increase in business, you are going to increase conversions, and you are going to save money. You are not going to use money when you don’t need to. It doesn’t matter how big your company is or what you do, using the day parting will help everybody.
Eric Enge: Let’s talk a little bit about match types.
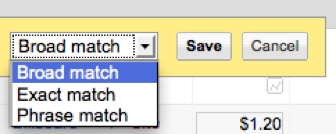
Justin Cutroni: Match types are another part of the integration between Analytics and AdWords. The match type has been used for a long time and is going to continue to change and improve.
Broad match campaigns give you a way to reach a really large audience without getting into too many details. However, you want to fine tune that over time and identify specific keywords that are really important and target those with exact matches or use phrase match to fine tune your account and get a better return.
Within Analytics we have a report for the matched search query.
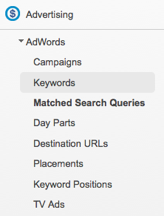
I really like this report because I can look at what someone types into Google and what it matched in my AdWords account and identify any differences.
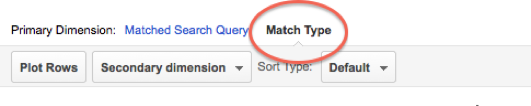
If you navigate to the matched search queries report in the Advertising > AdWords section, at the top of the table, you will be able to change the view to match type and see what happened for the traffic that came from broad matches, phrase matches or exact matches.
I like to click on broad match and drill down into all of the broad match keywords that I have in my AdWords’ account. This is where I like to use another feature that I don’t think is really leveraged enough: the secondary dimension.
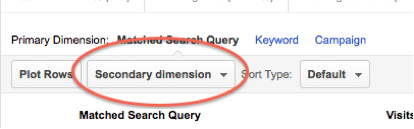
I can add a secondary dimension of keyword: now I have broad match terms in one column and keywords in the second column. Someone might have searched for “Easter chocolate” and that might have matched on “Easter” or “Easter gifts” or something else.
Here is another way that I can look for ways to improve. So if I see that in a broad match “Easter candy,“ someone typed in “Easter chocolate”, and I am getting a really good return on “Easter chocolate”, I might promote that and go in with an exact match to improve my performance. I can start to graduate things out of broad match and into exact match to fine-tune my account.
Eric Enge: That’s one of the things that a lot of advertisers don’t realize. Just because that broad match keyword picks up a particular phrase, (“Easter chocolate” I think was the phrase you used as an example, when the broad match term was “Easter candy,”) it is still worth taking those terms and bidding on them in exact match mode.
Justin Cutroni: Absolutely. This is another great place where you can switch over and look at the eCommerce or goal conversion data and sort by your conversion rates. Now you’re starting to use some really heavy features in AdWords.
We could even get into a feature called advanced segments and drill into even more segmentation. I know you are a huge fan of segmentation, I am too.
Eric Enge: Yeah.
Justin Cutroni: Well, we could even start to segment by geographic location. For example, just focus on the New York or Chicago area. Now I have match type, keyword, and geographic location. The whole idea here is that we can go back into AdWords and say: For this geographic location I want to fine tune my keywords in this specific way and then tweak your settings. We are giving you data that reflects all of those different levers in AdWords so that you can keep fine-tuning and making incremental changes.
Eric Enge: Right. Then, of course, the thing you want to do is focus on the keywords that have the biggest impact, because that is where you get the best returns on these kinds of effort and analysis.
Justin Cutroni: That’s the great thing about that weighted sort feature. It is going to tap those things that are going to have a high impact.
Eric Enge: Anything more you want to add to match types or should we try another one?
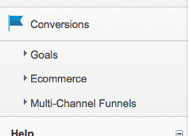
Justin Cutroni: Let’s talk about the Multi-Channel Funnel:
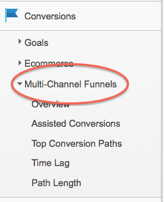
Multi-Channel Funnel, a section we have in Google Analytics, is all about helping you to understand the multi-touch behavior and journey that customers have on their way to conversion.
People might take multiple visits to convert and that might be multiple clicks in AdWords. In Multi-Channel Funnels, we are providing a whole bunch of information about the length, time and touch points of your sales cycle. You will notice the assisted conversions report in the Conversions, Multi-Channel Funnel reports. This report is not only going to show you the conversion and the revenue, but it is going to divide them into two groups.
First, there is last interaction conversion and last interaction value. This is similar to the current last click model. You will see the campaign or ad group and how it performed at the last click. You can choose which goal you want to analyze in this report.
You will also see something new, called “assisted conversion” or “assisted conversion value.”
What that helps you understand is: “where does this campaign or keyword appear in the visitors’ journey prior to conversion?” This is the report you look at after you are looking at your basic campaigns report. Now I can go and look for all of those campaigns and ad groups that didn’t generate any revenue and see if they did help drive traffic before conversion. All of a sudden, you don’t just kill something that is not getting you any revenue, because it may eventually assist in a conversion.
Eric Enge: What kind of channels are included in this data?
Justin Cutroni: In the Multi-Channel Funnels, if you are just using the report in regular mode, it’s going to automatically group your traffic into channels: social, display, cost-per-click, organic traffic, direct traffic, etc. It will (based on referral information) auto-detect where people are coming from. You can configure that if you want to change the grouping. Or you can view the data based on campaign, ad group, etc.
Eric Enge: I presume this uses cookie-based tracking, is that how that works?
Justin Cutroni: We do use some cookies in Google Analytics. When you land on the site, we know where you came from and we store that in a cookie, but we also have the ability on our back-end to connect the dots and say: “Eric did this sequence of visits over the last month.”
It’s all completely anonymous data because we don’t believe in tracking the individual. We track you as part of a group or segment.
Eric Enge: Are you tying it to my being logged in?
Justin Cutroni: No, it actually has nothing to do with you being logged into anything. Let’s use an example of an online chocolate store.
Let’s say I am looking for a Mother’s Day gift. Maybe I do a search for a chocolate and go to a particular website. Google Analytics will record that visit, it will record that I clicked on AdWords and that I am not ready to buy today.
Next week I may do another search because I really want to fine tune and I don’t just want chocolate, I want the salted caramel chocolate. The same website I visited last week may come up again and I may click on another AdWords ad.
Analytics now knows I visited once on Monday from an AdWords’ ad and didn’t convert, but visited a week later from an AdWords’ ad and did convert. It doesn’t have anything to do with me logging into that vendor’s site or anything, it is just the fact that the cookie identified me as the same person.
Eric Enge: This is incredibly important stuff. Attribution is a big deal because it varies by business. For some businesses, multiple touches before sale is the norm, not the exception
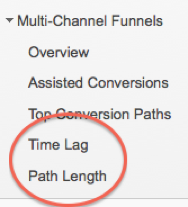
Justin Cutroni: A really great place to start is that Multi-Channel Funnels section. In it, there are two really simple reports. One is called time lag and one called path length.
Time lag is the time between someone’s first visit and when they do a conversion. Path length is the number of visits between your first visit and when you convert.
Using those two reports, you can understand if you even need to worry about multi-touch. What I have seen a lot is that multi-touch is happening, but it is the time that is different. For a smaller type purchase, maybe sneakers or a book, you might have a couple of visits within a day. With a more expensive type of purchase, you might have a few visits scattered over a week or two weeks. Those two simple reports will tell you if even really kind of need to worry about this whole multi-touch thing. I think most people do need to look at it, but for a lot of people it’s not going to be straddled over a long period of time. It is going to be compressed into a shorter period of time.
Eric Enge: Is there a way to associate a value with the different touches? How does that work?
Justin Cutroni: You can actually segment these reports with a feature called conversion segments. When you are looking at a path, whether it is in that Assisted Conversions report or a path length report, you can create a segment and separate data based on your high-value conversions versus your low-value conversions. You can’t actually apply a value to each specific visit in the past; it’s all based on the goal or the transaction that happens at the end of the conversion path.
Eric Enge: That sounds like a fun area where you can get a lot of headaches, but a lot of value too.
Justin Cutroni: Yes, and I will just point out that another part of AdWords that I think is really getting very awesome: the Display Network.
Eric Enge: I was going to ask you about that.
Justin Cutroni: I remember, even four years or five years ago, when everyone suggested turning off the Display Network, but the cool thing is, again, we are giving you information about the Display Network and how it is working in Analytics.
Whether you are using automatic placement or managed placement, we have data about both of those in Google Analytics. There is a placements report in the AdWords section that will tell you not only the placement type (like managed or automatic) but allow you to see the placement domain.
So, if you know you are running automatic placements, you can drill in there and evaluate how well they are working. If you have some automatic placements that’s underperforming, you can go in and remove that. If you have an automatic placement that is doing really well, you might move that into a managed placement. The idea is that, in Analytics, you are going to be able to see the placement domain and the actual ad format and location on that site so that you can then go back into AdWords and tweak your ads to run in those spots.
We have really detailed information so you can get the most out of the display network. You can even take it back to what we were talking about multi-channel. I can go through Multi-Channel Funnels again and I can use it to look at the placement domain. If I am not getting the revenue from Display Network, let me jump over to Multi-Channel Funnels and understand what are they doing in terms of Assisted Conversions. This elevates the usefulness of the Display Network.
Eric Enge: I think something that is still at the forefront of what people should do is have your Display Network set up in a different campaign The use of keywords is entirely different from how it is used in a regular AdWords campaign.
Justin Cutroni: I couldn’t agree more.
Justin Cutroni: Also, there are a lot of settings you can customize for your display advertising campaigns. You have many levers that you can pull, so segmenting display advertising into their own campaign is a good way to focus on that type of advertising.
Eric Enge: When you look at these view-throughs, you have to step back and say: “okay well what was that worth to me.” I think it’s a really good idea for people to go through the discipline of deciding what the value of a view-through type of conversion is to them so that they can actually decide how they want to invest in this piece of their campaign.
[Note, at this time View Through conversions are not part of Google Analytics or Multi-channel funnels.]
Justin Cutroni: That’s a great point. One thing I love about the Assisted Conversions report and Multi-Channel Funnels, is that we are trying to help you with that. Now you can say: this placement on Marthastuart.com didn’t generate direct revenue, but it assisted in $35,000. Now I have a good way to go and determine what I should be spending.
Eric Enge: Anything else you wanted to add for us today, Justin?
Justin Cutroni: To be honest, at some level, we are still just scratching the surface because with Analytics we can do so many other things. I would just encourage everyone to really take advantage of all the features in Google Analytics because they can really help you fine-tune AdWords.
Eric Enge: Thanks for taking the time to talk to us today.
Justin Cutroni: Thank you, this was really fun. I appreciate it.